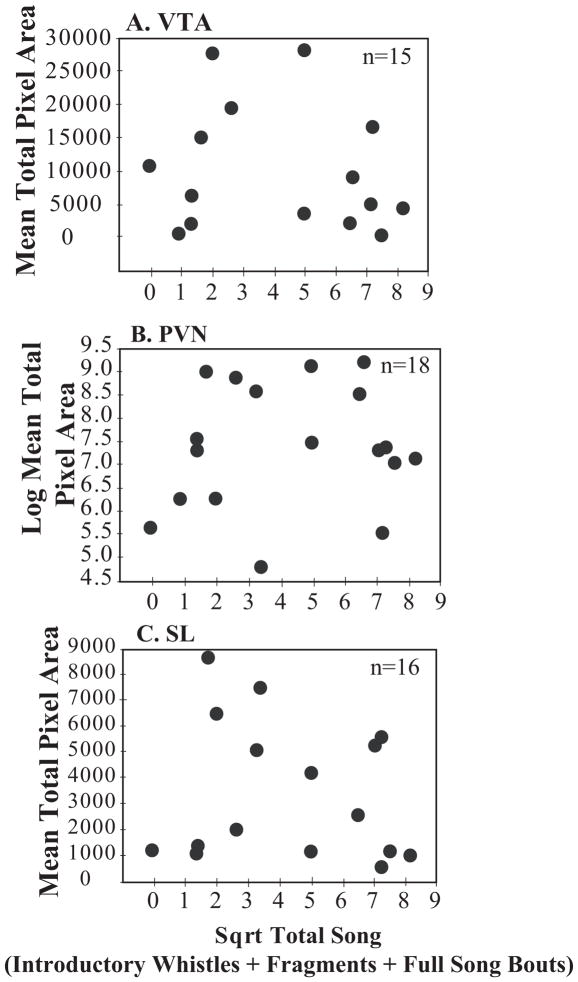
Figure 3.
Relationships between the area covered by mu-opioid receptor label (mean pixel area) and undirected song. The measure of undirected song is on the x-axis and the mean mu-opioid receptor total pixel area is on the y-axis in A) VTA, B) PVN, C) SL. Individual birds are represented by a single black dot. Sample size indicated in the upper right corner of the figures.

