
Figure 4.
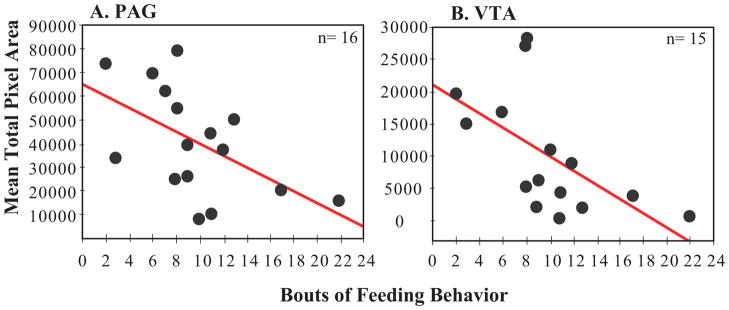
Relationships between the area covered by mu-opioid receptor label (mean pixel area) and bouts of feeding behavior. The total number of bouts of feeding is on the x-axis and mean mu-opioid receptor total pixel area is on the y-axis for A) PAG and B) VTA. Individual birds are represented by a single black dot. Sample size is indicated in the upper right hand corner of the figure. Presence of the red regression line indicates a significant relationship p<0.05.