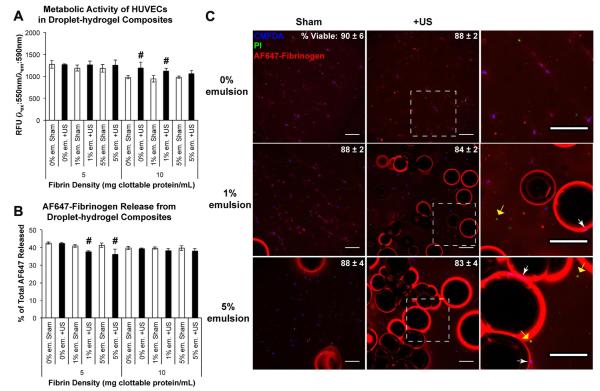
Fig. 7.
Effects of ultrasound (US) exposure on HUVECs in droplet–hydrogel composites. The metabolic activity (A) and release of AF647 fibrinogen (B) from HUVEC composites were measured 2 days after ADV. Data are shown as mean ± standard deviation for n = 5 (metabolic activity) and n = 4 (release). #p < 0.05 vs. sham control. CMFDA (blue)/PI (green) labeling of HUVECs in 5 mg ml−1 fibrin constructs demonstrates proximity of viable cells to bubbles formed by ADV (C). The percentage of viable cells (mean ± standard deviation; n = 3) for each condition is given in the upper right. The right column displays zoomed-in panels from the center column (denoted by the boxed regions). Viable (white arrows) and necrotic cells (yellow arrows) are observed adjacent to the bubbles. Scale bars = 200 μm.

