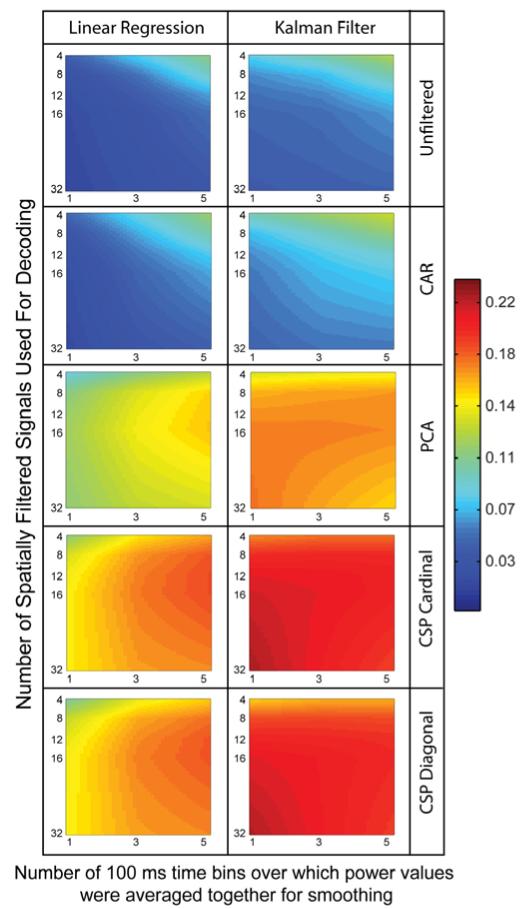
Figure 4.
Average position decoding performance as measured by the coefficient of determination, R2, calculated between the actual and predicted continuous wrist position. Continuous position decoding accuracy (R2) is shown when using a linear regression decoder (left column) or a Kalman filter decoder (right column) with five of the spatial filtering options. Only the 67%-removed variant is shown for the CSP filters. Additional CSP options look similar and can be found in the supplement. Mean R2 values are plotted as a function of the amount of smoothing applied to the power values and the number of spatially filtered signals used for decoding. Data shown are averaged across all 64 recording sessions, all ten crossvalidation testing sets per session, and the X and Y components of continuous wrist position.

