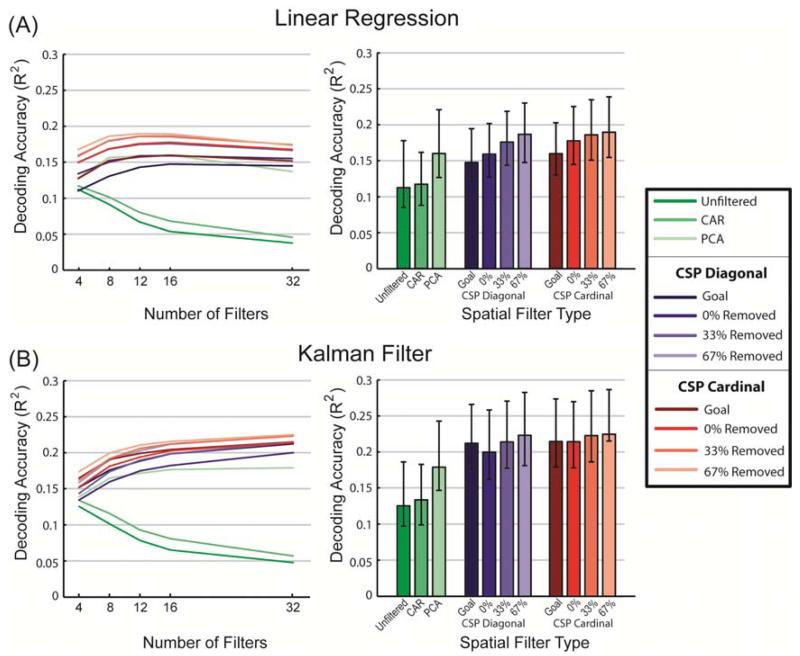
Figure 5.
Average position decoding accuracy (R2) of different spatial filtering methods at the optimal smoothing. A) Linear regression decoding. B) Kalman filter decoding. Line graphs on the left show how each filter type preformed when different numbers of filters were used for decoding under optimal smoothing conditions. Bar graphs on the right represent the decoding accuracy when both smoothing and number of filters were optimized independently for each filter type. As in figure 4, the R2 values represent the coefficient of determination between the actual and predicted continuous wrist position data (values are averaged across the X and Y movement components and cross-validation testing sets; error bars in the right bar graphs indicate the standard deviation of these values across the 64 recording sessions).

