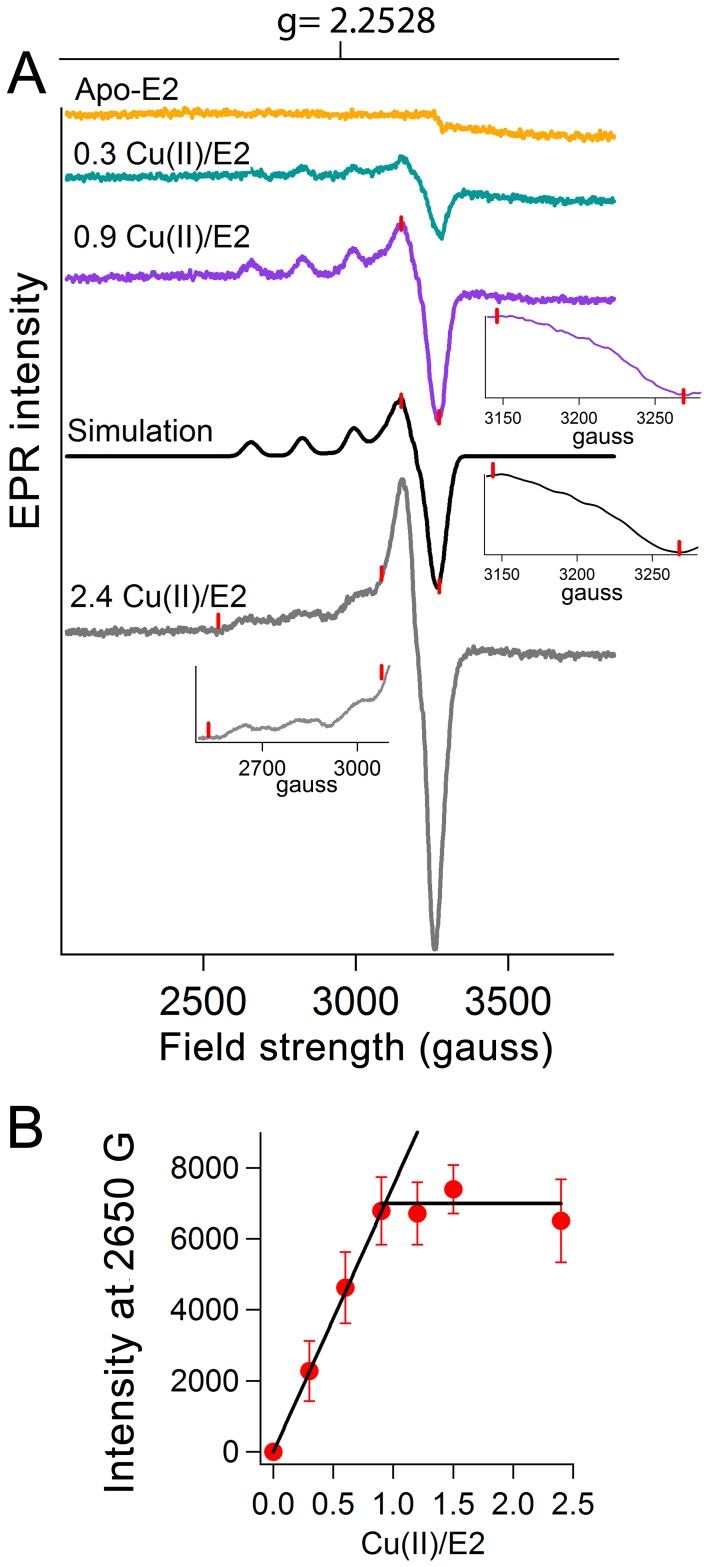
Figure 3. Cu(II) binding to the E2 domain of APP measured by EPR spectroscopy.
(A) Binding of Cu(II) to the E2 domain of APP was recorded using electron paramagnetic resonance spectroscopy (EPR). Simulation of the EPR spectrum of Cu(II) bound to the E2 domain was performed using 4 nitrogen atoms as coordinating ligands for the 0.9 Cu(II)/E2 sample. The simulation parameters were: g⊥ = 2.053 and g∥ = 2.2528; line widths (gauss) were 11, 11, and 15; copper hyperfine splittings (gauss) were: 24, 24, and 176 gauss; nitrogen hyperfine splittings (gauss) were: 18, 18, and 11. The inserts show enlargements of part of the spectra which are marked by red lines. (B) The EPR intensity at 2650 gauss is plotted as a function of the amount of Cu(II) added to E2 domain. A 159 mM solution of E2 domain in 100 mM Mops 150 mM NaCl pH 7.0 was used.

