
Figure 5. Abundance analysis of observed bacterial lineages.
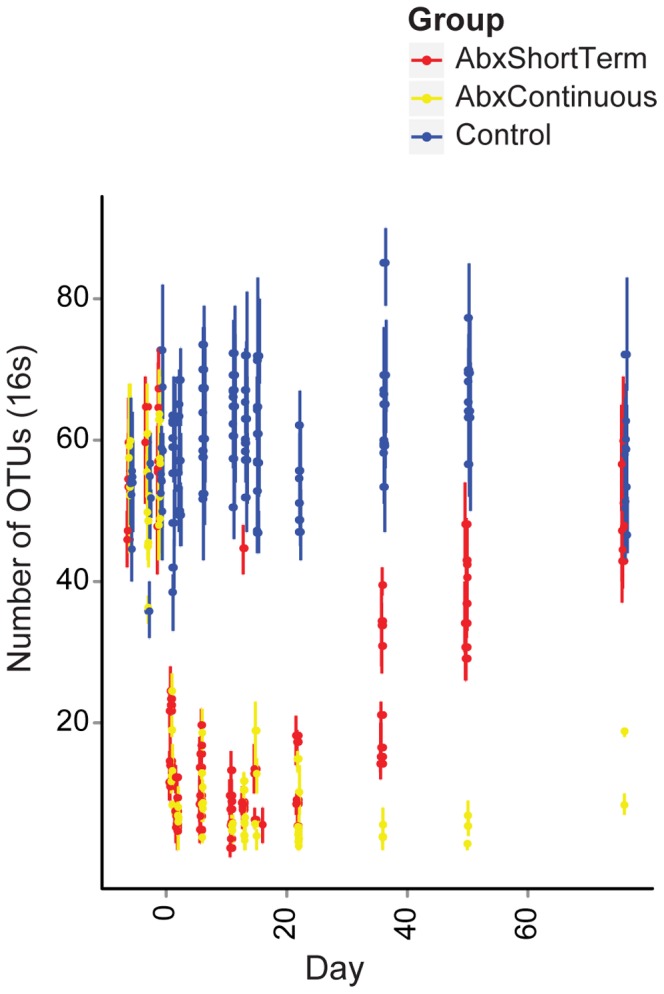
Each sequence set for each animal was rarefied to 200 sequences per sample 10 times, and the number of different OTUs assessed. Means are indicated by points, error bars indicate the range observed. The groups studied are indicated by the key at the right.