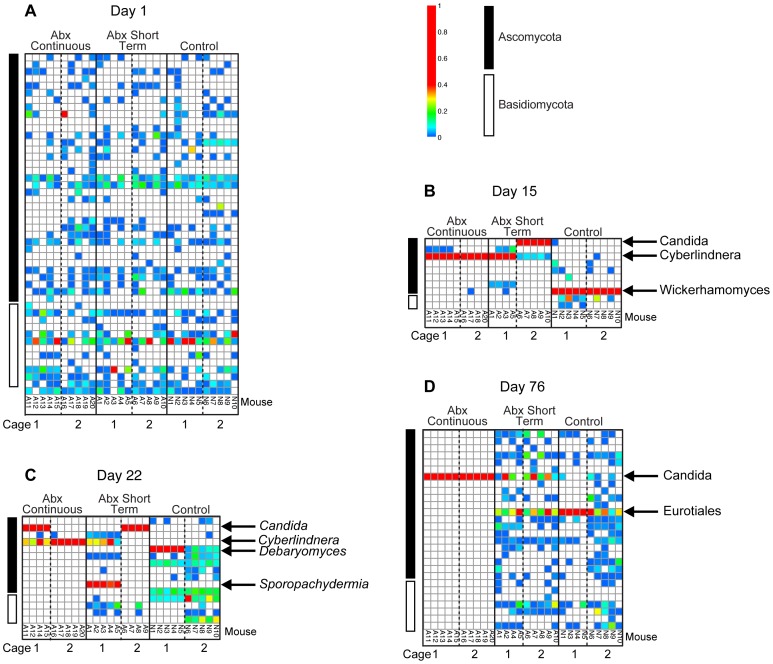
Figure 6. Longitudinal analysis of fungal lineages inferred from ITS rRNA gene sequencing.
Fungal lineages detected are summarized in heat map format. Data for four days are shown (days 1, 15, 22, and 76). Each column indicates a single mouse. The groups tested are indicated at the top of the columns. The ten mice in each of the three treatment groups were each housed in two cages of five each. The distribution of mice in cages is indicated at the bottom of the columns. The day of treatment is indicated at the top. The color codes at the top right indicate the proportions and Phyla of origin.

