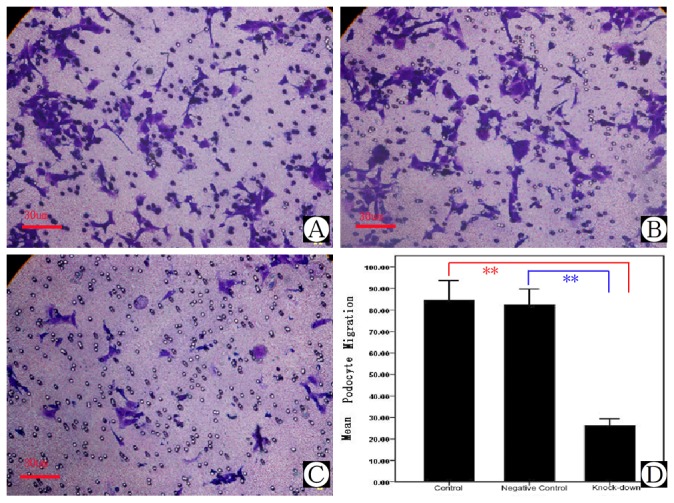
Figure 6. Migration assay of Myo1e depleted podocytes.

A) Podocyte migration in control group. B) Podocyte migration in scrambled negative control group. C) Podocyte migration in MYO1E knock-down group. D) Comparison of mean migration effects of podocytes in different groups. **Compared with the results of control and negative control group, podocyte migration in the MYO1E knock-down group was down-regulated, P<0.01.
