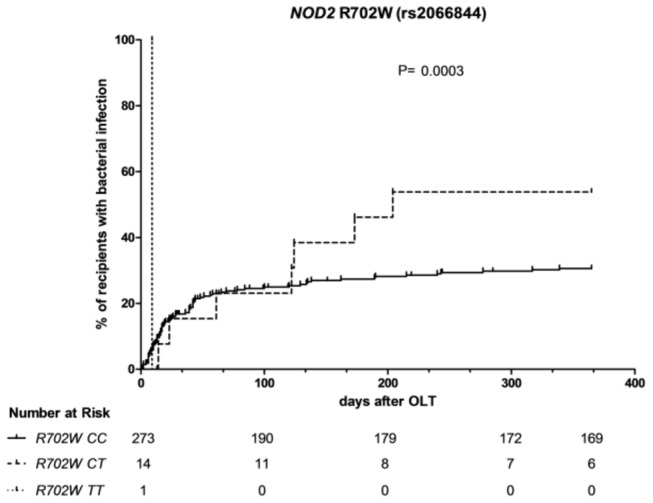
Figure 1. Development of clinically significant infection over time in relation to the recipient NOD2 R702W genotype.

Occurrence of clinically significant infection in days after OLT in relation to the recipient NOD2 R702W genotype. CC = wildtype, TT homozygote for mutation, CT = heterozygote. The numbers below the Kaplan – Meier curves represent the number of individuals ‘at risk’ per genotype at particular time points after transplantation.
