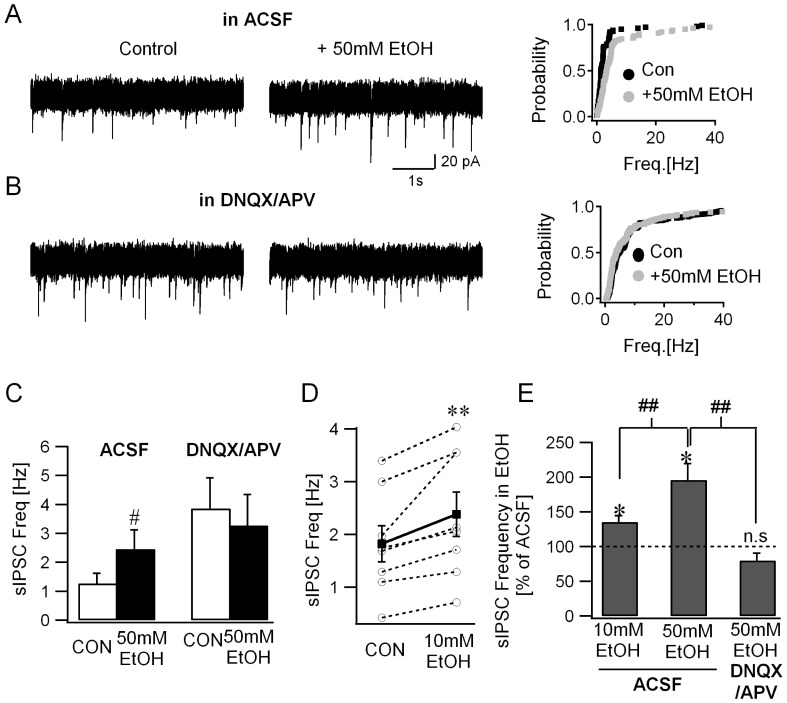
Figure 2. Blocking glutamatergic transmission abolishes ethanol-effects on granule cell sIPSC frequency.
A. Representative granule cell current traces recorded in ACSF (CON, left panel) and during perfusion of 50 mM ethanol (EtOH, middle panel). Cumulative probability plots (right panel) compare the frequency of individual sIPSC in ACSF (CON) and after perfusion of 50 mM ethanol (same number of events from n = 5 cells; p<0.05 by K-S test). B. Granule cell current traces recorded in the presence of the GluR antagonists 20 µM APV and 25 µM DNQX (CON, left panel) and after inclusion of 50 mM ethanol (EtOH, middle panel). Cumulative probability plots (right panel) show the frequency distribution of individual sIPSCs in APV/DNQX (CON) and after addition of 50 mM ethanol (identical number of events from n = 6 cells; p<0.05 by K-S test). C. Summary data of the sIPSC frequency averaged over 30 second periods in control conditions before addition of ethanol (CON) and in the presence 50 mM ethanol. The frequency of sIPSCs recorded in ACSF is compared with the effect observed in DNQX/APV (# indicates p<0.05 by two-way repeated measures ANOVA followed by post-hoc analyses by Holm-Sidak method). D. Summary data of the sIPSC frequency averaged over 30 second periods in control conditions before addition of ethanol (CON) and in the presence 10 mM ethanol. Individual data points are represented by open circles connected by dotted lines. (** indicates p<0.05 by Wilcoxon Signed Rank test). F. Summary histogram of the sIPSC frequency in ethanol, normalized to frequency in the same cell prior to perfusion of ethanol (n.s. denotes p>0.05, * indicates p<0.05 by paired t-test and ## indicates p<0.05 by one-way ANOVA followed by post-hoc analyses by Holm-Sidak method).

