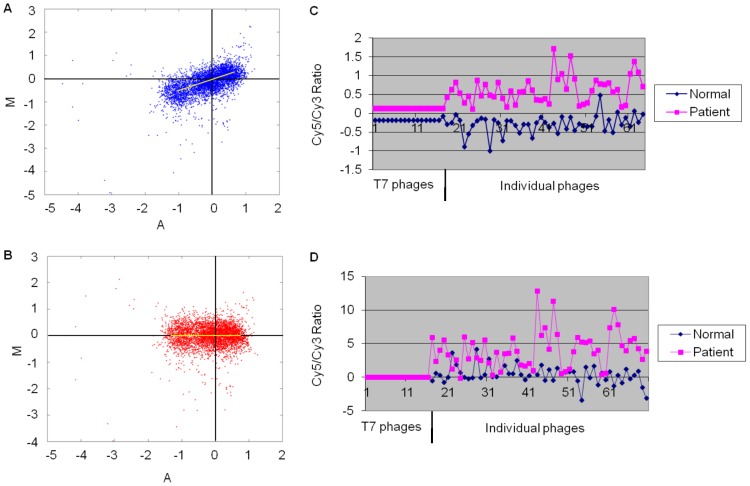
Figure 2. Lowess smoothing and T7 normalization.
Lowess smoothing was used to remove intensity-dependent variations during fluorescence staining, A Lowess curve is calculated by fitting a line to the local neighborhood of each data point, and aggregating the line segments into a curve which is used to adjust each spot's value. A Lowess curve calculated after normalization should be a straight line with zero slope, indicating that ratio values are no longer dependent on intensity. (A) MA plot* before lowess smoothing, the majority of intensities were fluctuate. (B) MA plot after lowess smoothing, the majority of the point’s intensities were evenly distributed around zero. (C) Chip-to-chip variability was normalized by empty T7 phage proteins which were spotted as standard control on the slides. (D) Patterns of signal ratio distribution after normalization by empty T7 phages. *MA plot is a plot of the distribution of the red/green intensity ratio ('M') plotted by the average intensity ('A'). The equations for M & A are M = log2(R/G) = log2(R)-log2(G), A = 1/2log2(RG) = 1/2(log2(R)+log2(G)).The majority of the points on the y axis (M) would be located at 0, since Log (1) is 0. If this is not the case, then a normalization method like lowess should be applied.

