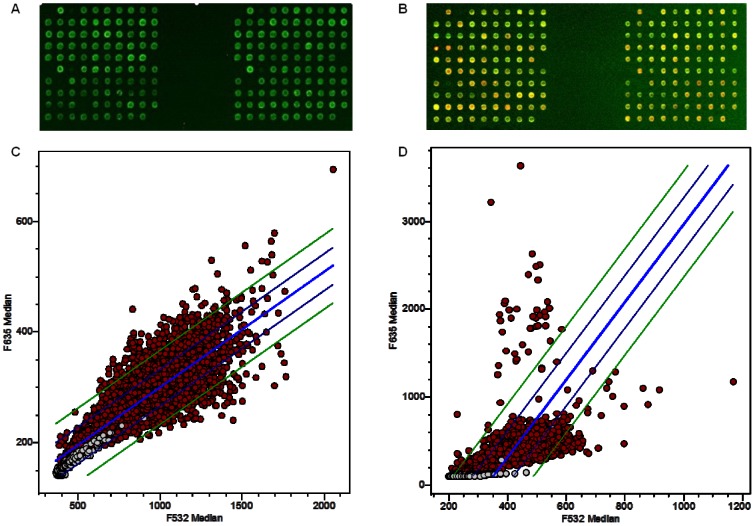
Figure 3. Protein microarray screening.
Biopanned phage clones were spotted on microarray slides and tested with MM or normal serum samples. Scatter plots with linear regression show the differences between patient group and normal group. (A) The image of phage protein microarray tested by normal serum; (B) The same potion of the microarray tested by patient serum sample. (C) Linear regression was generated by GenePix software with normal sample. (D) Linear regression and 2SD lines were generated with patient sample.

