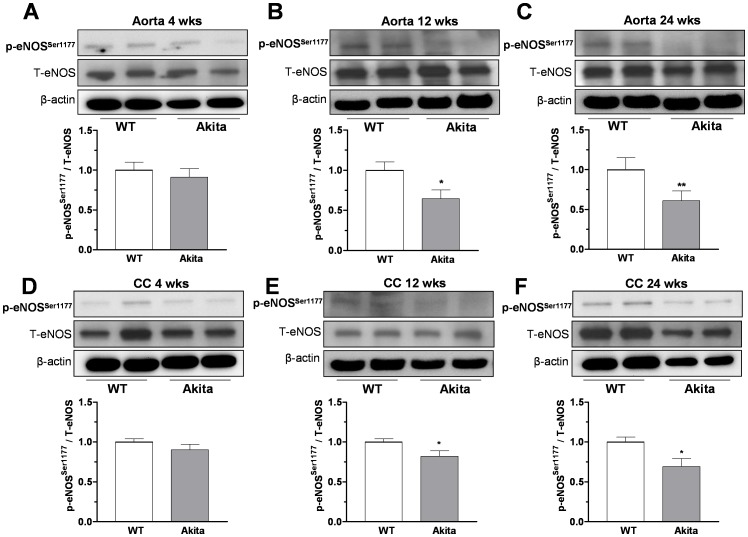
Figure 8. Protein levels of phospho-eNOSSer −1177 in aorta and corpus cavernosum (CC).
Levels of phospho eNOS (at Ser-1177), total eNOS, and β-actin were determined in aorta (panel A–C) and CC (panel D–F) from wild type (WT) littermate and Akita mice at 4, 12 and 24 weeks of age. Representative blots are shown in the top of each panel. Densitometric analysis was carried using Gene Snap software, results normalized to β-actin and expressed as arbitrary units. Data represent the mean ± S.E.M. of 6 experiments (each group). * p<0.05; ** p<0.01, compared to WT mice.

