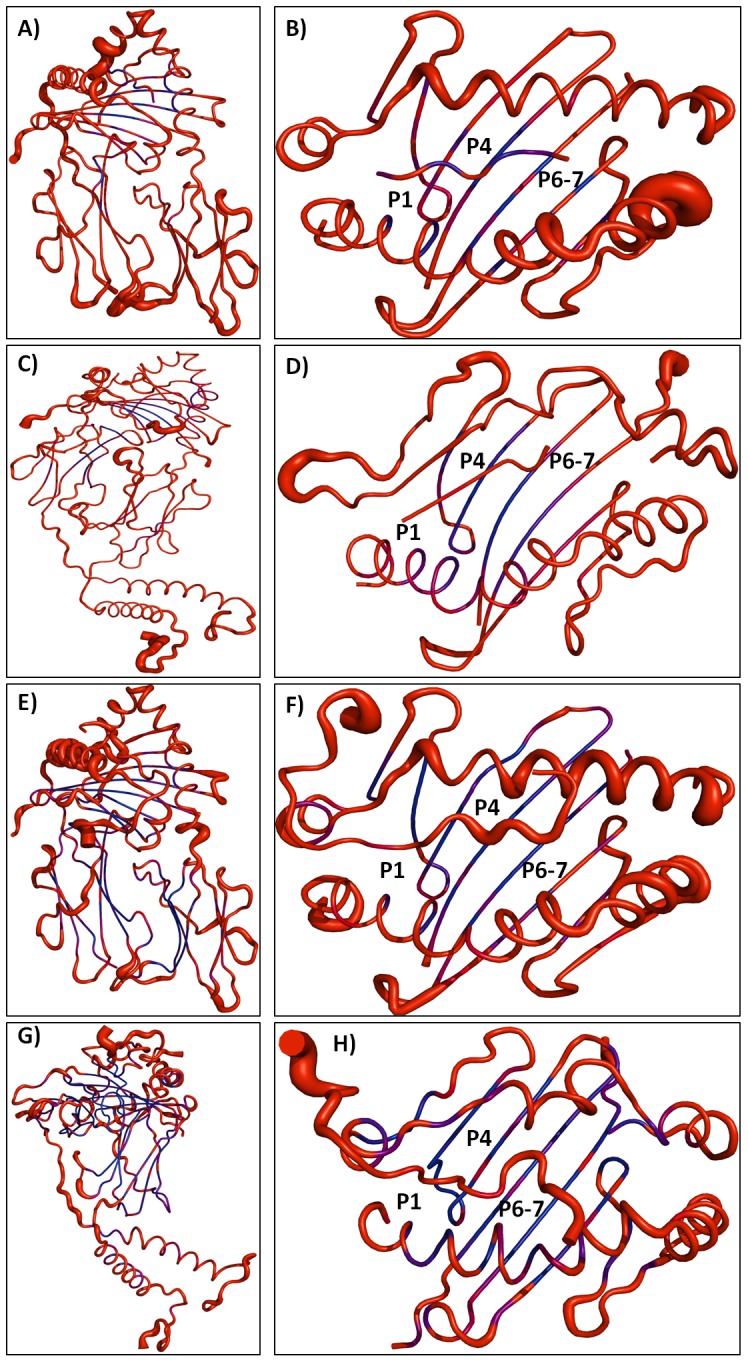
Figure 6. pMHC-II complexes color-coded according to their B-factors.

A-B) MHC-II-P7w complex. C-D) MHC-II-P7m. E-F) MHC-II-P22w and G-H) MHC-II-P22m. Complexes are drawn in cartoon representation and color-coded according to the B-factor of Cα atom, from blue (lowest B factor: less than 30 Å2) to red (highest B factor: greater than 50 Å2). B-factors were obtained from the average RMSF values.
