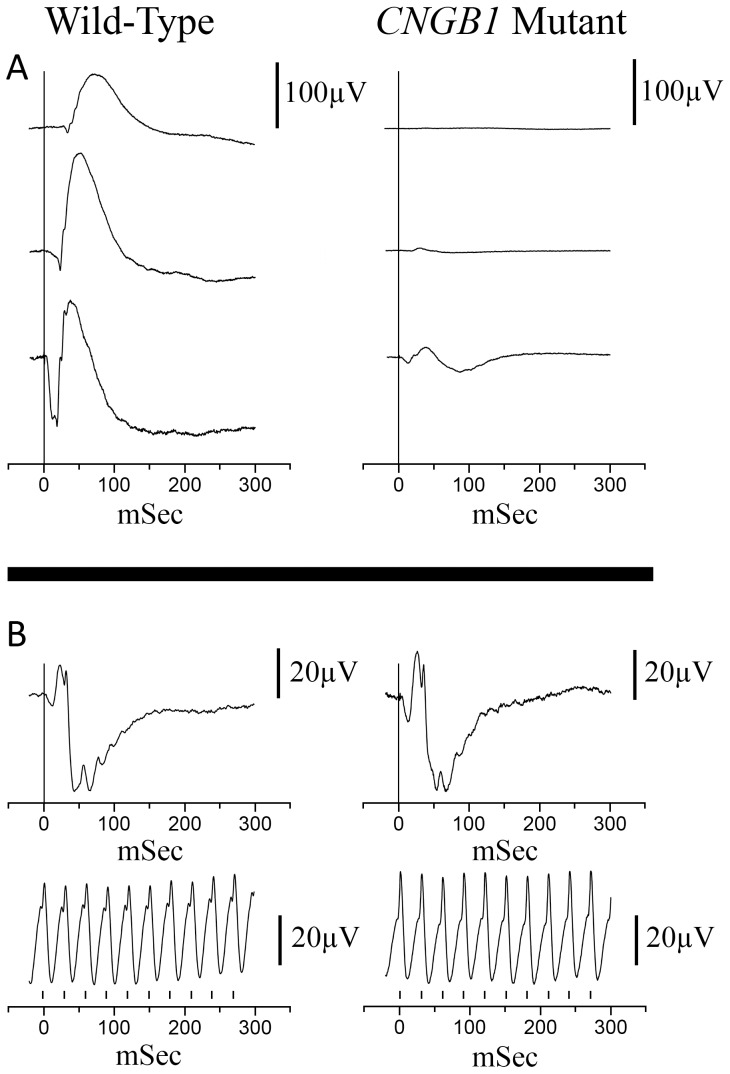
Figure 1. Representative ERG tracings from a normal control Papillon and a PRA-affected Papillon, both 10 weeks of age.
A. Dark-adapted ERG recordings at −2.4, −1.2 and 0.4 log cdS/m2. B. Light-adapted flash and flicker (33 Hz) ERG tracings. Background white light of 30 cd/m2 and flash intensity of 0.4 log cdS/m2. The vertical bars on the flicker ERG indicates the flash timing.

