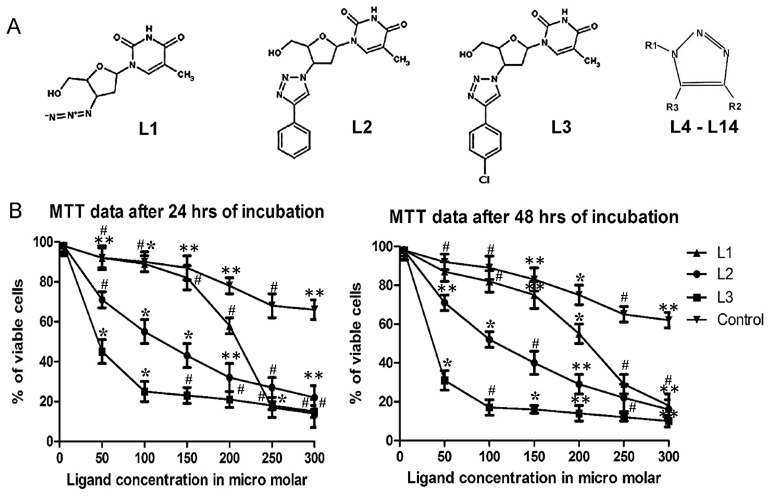
Figure 3. Structure of ligands used and the MTT assay.
A. Structure of nucleoside 1,2,3-triazole ligands L1, L2, L3 and the basic structure of non-nucleoside 1,2,3-triazole ligands (L4–L14). The position of various pharmacophores on ligands (L4–L14) are labelled with -R1, -R2 and -R3. B. MTT assay with B16F10 cells on treatment with 50 µM, 100 µM, 150 µM, 200 µM, 250 µM and 300 µM concentration of L1, L2 and L3 for 24 h and 48 h. The set of data with reducing order of significance (p value≤0.001, 0.01 and 0.05) were marked with *, # and ** respectively.

