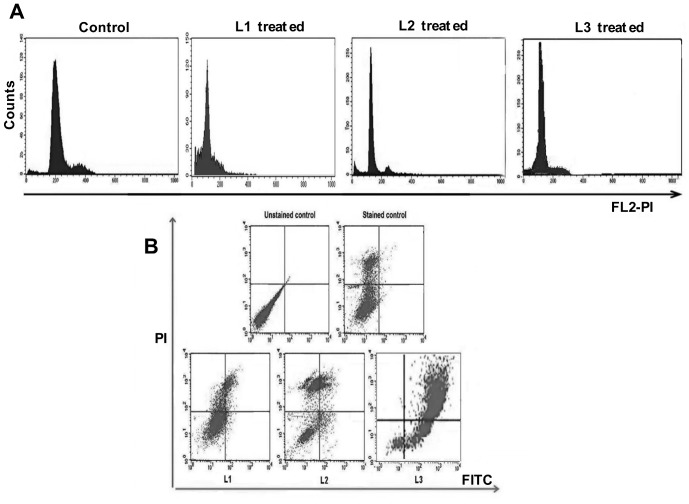
Figure 4. Cell cycle and dot plots obtained with three nucleoside ligands.
A. Untreated, L1, L2 and L3 treated B16F10 cell lines were stained with Propidium Iodide (PI) and cellular DNA content frequency histograms were shown. B. B16F10 cells and L1,L2 and L3 treated cells were stained with Annexin V and Propidium Iodide and analysed for various types of cells like alive (LL), early apoptotic (LR), late apoptotic (UR) and necrotic cells (UL).

