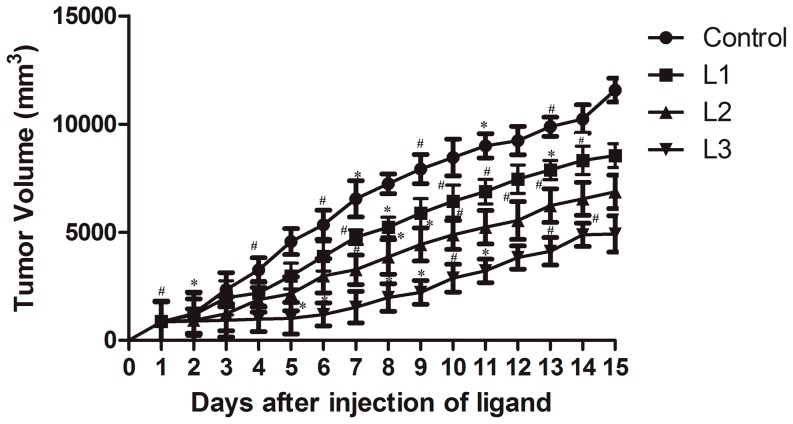
Figure 6. Varation of induced tumor size on treatment with nucleoside ligands.
Tumor was induced in C57BL6/J mice by injecting B16F10 cells subcutaneously and treated with 200 µM of L1, 125 µM of L2 and 50 µM of L3 and an equal volume of 1∶1 methanol: water (without ligand) was treated as vehicle control. Group treated with an equal volume of 1∶1 methanol: water, vehicle control (4 mice) marked •. Group treated with L1, L2 and L3 (4 mice each) were marked ▪, ▴ and ▾ respectively. Tumor volumes were measured at fixed time points and expressed in mm3. Each experiment was repeated thrice and the mean values were plotted. The set of data with p value≤0.001 and 0.01 were marked with * and # respectively. The statistical data with p value≤0.05 was left unmarked.

