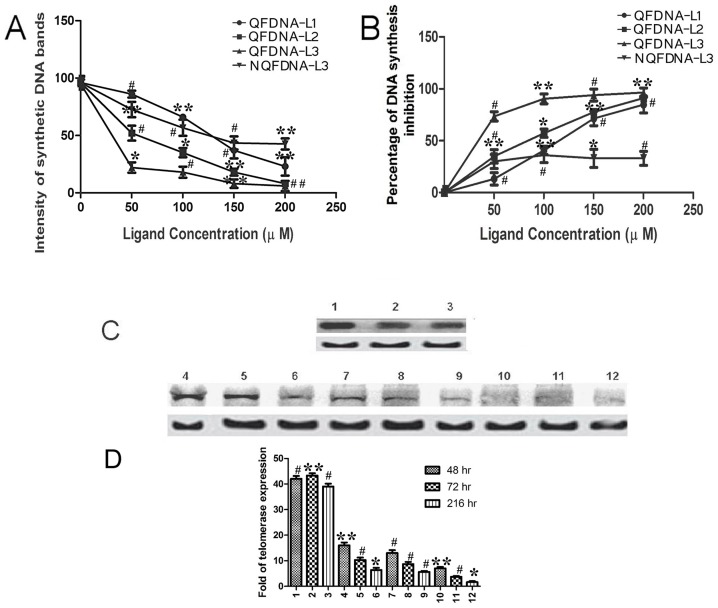
Figure 7. Effect of ligands on in vitro DNA synthesis inhibition and telomerase expression.
A. Line graph indicating the variation in band intensity with L1, L2 and L3 ligands at various concentrations using QF DNA and L3 alone with NQF DNA. B. Percentage of DNA synthesis inhibition by L1, L2 and L3 with QF DNA and L3 alone with NQF DNA. C. Western blot showing the TERT and β-actin bands. Lane 1,2,3 corresponds to 48 h, 72 h and 216 h of treatment with vehicle control (control samples); lane 4,5,6, lane 7,8,9 and lane 10,11,12 corresponds to 48 h, 72 h and 216 h of L1, L2 and L3 treatment respectively. Top and bottom bands correspond to TERT and β-actin respectively. D. Bar graph showing the comparative intensities of each band in western blot. The numbers marked on the x-axis represents the number of sample in western blot. The set of data with reducing order of significance (p value≤0.001, 0.01 and 0.05) were marked with *, # and ** respectively.

