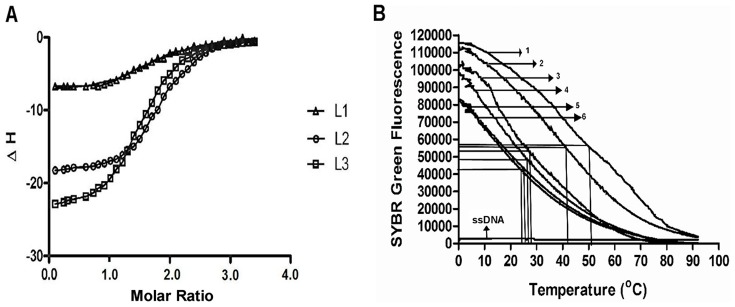
Figure 8. Microcalorimetric and DNA melting studies in presence of nucleoside ligands.

A. ITC binding isotherms obtained when L1, L2 and L3 ligands were titrated with HQF DNA in 100 mM KBPES (pH 7.0) buffer. B. Melting profile of DNA with various ligands. HQF DNA +L3 (marked-1); HQF DNA+L2 (marked 2); HQF DNA+ L1 - (marked 3) ; HQF DNA alone - (marked 4); dsDNA+ L3 ( marked 5); dsDNA alone (marked 6) and ssDNA (poly-dT alone).
