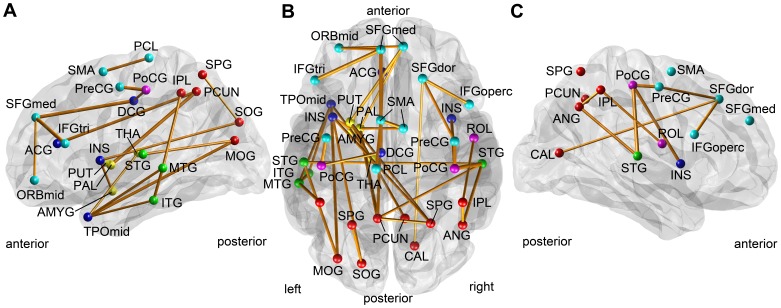
Figure 3. The identified sub-network correlated with the disease severity: subcortical vascular mild cognitive impairment.
The figure shows in the lateral view of the left hemisphere (A), the transverse view of both hemispheres (B), and the lateral view of the right hemisphere (C). The identified connection was shown as an orange line, whose thickness represents the magnitude of its correlation coefficient between its edge weight and CDR-SOB. The identified node was shown with a colored sphere, whose color represents the lobe to which it belongs: frontal (cyan), limbic (blue), central (magenta), temporal (green), parietal and occipital (red).

