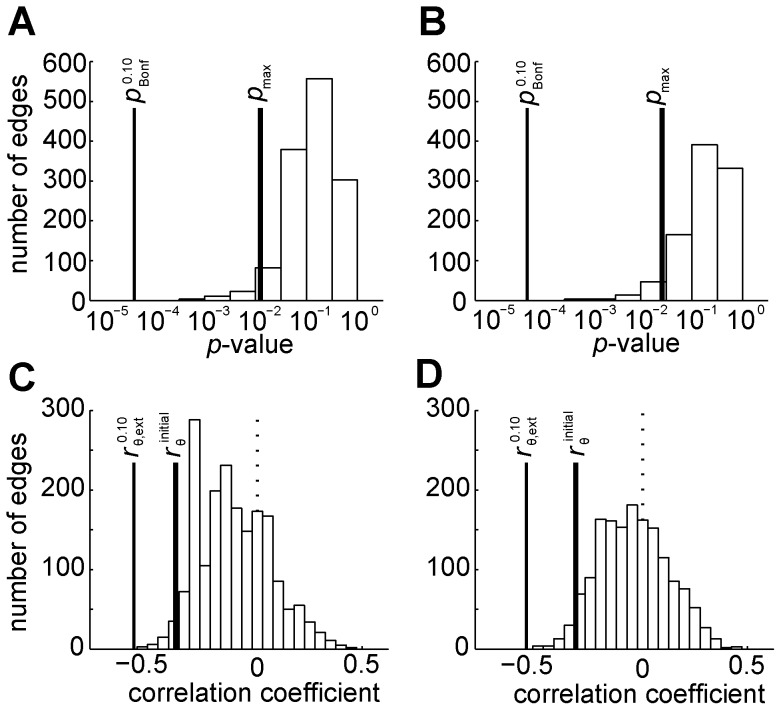
Figure 5. Comparison to the other multiple comparison correction methods.
To compare with Bonferroni correction and FDR procedure, we drew histogram of p-values in log-scale whose correlation coefficients are negative, showing the thresholding p-value of Bonferroni correction with α = 0.10,  (thin solid vertical line), and the maximum of uncorrected p-values of network connections in the proposed cluster-based correction, p
max (thick solid vertical line), for patients with svMCI (A) and SVaD (B). We note that the thresholding p-values of the FDR procedure with q = 0.05 and 0.1 cannot be shown in log-scale, because they both are exactly zero, leading no significant findings. To compare with extreme statistics, we drew the histogram of raw correlation coefficients (Spearman, partial correlation adjusting age and gender), showing 10% threshold of the extreme statistics,
  (thin solid vertical line), along with the initial threshold,
  (thick solid vertical line), in patients with svMCI (C) and SVaD (D), where dotted vertical line indicates the zero correlation coefficient.

