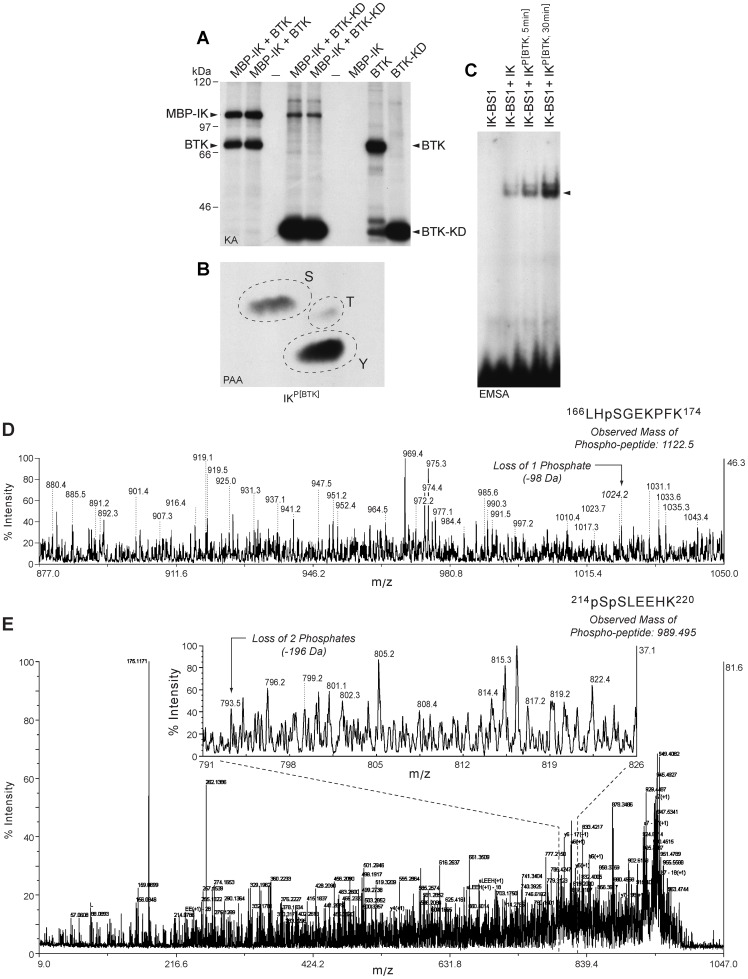
Figure 4. Phosphorylation and Activation of Recombinant Ikaros by Recombinant BTK and BTK-KD.
[A] Recombinant full-length BTK as well as BTK-KD showed autophosphorylation and it also phosphorylated MBP-tagged recombinant IK1 in hot kinase assays in the presence of [gamma-32P]ATP. Depicted is the autoradiograph of the kinase reaction products. The positions of the autophosphorylated BTK kinase band and BTK kinase domain band as well as the phosphorylated recombinant IK band are indicated with arrows. [B] Phospho amino acid analysis of the BTK phosphorylated MBP-IK1 band showed phosphorylation on tyrosine and serine. The 32P-labeled MBP-IK1 band in [A] was isolated and subjected to PAA. The positions of ninhydrin-stained phosphoamino acid standards (phosphoserine [S], phosphothreonine [T], and phosphotyrosine [Y]) are indicated with circles. [C] EMSA's were performed with a 32P-labeled double-stranded IK-BS1 oligonucleotide probe containing a high-affinity IK binding site (1 ng/sample, 100,000 cpm) and purified MBP-tagged recombinant IK1 protein (200 ng/sample) that has or has not been phosphorylated by recombinant BTK as in panel A. Lane 1, IK-BS1 probe only. Lane 2, unphosphorylated IK1 (200 ng) was mixed with 1 ng radiolabeled IK-BS1. Lane 3/Lane 4, BTK-phosphorylated MBP-IK1 (MBP-IK1Phos(BTK)) was mixed after a 5 min vs. 30 min kinase assay with 1 ng radiolabeled IK-BS1. MBP-IK1Phos(BTK) exhibited augmented binding to IK-BS1 when compared to MBP-IK1. [D&E] Mass spectrographs of phosphopeptides from BTK-phosphorylated recombinant IK1 protein. A MALDI-TOF/TOF mass spectrometry analysis was performed on trypsin-digested recombinant IK1 after an in vitro kinase reaction with purified recombinant BTK. Supel-Tips (Sigma-Aldrich) were used for phosphopeptide enrichment. Tryptic peptides were desalted and concentrated using the Millipore C18 reverse phase Zip-Tips column, eluted in 0.5 μL of matrix solution and spotted on the MALDI plate. MALDI-TOF MS was performed on an AB Sciex Proteomics Analyzer. MS spectra were acquired in reflection positive ion mode, averaging 4000 laser shots/per spectrum. The masses of the peptides after neutral loss 1 (−98 kDa) or 2 (−196 kDa) are indicated with arrows. [D] CID spectrum shows neutral loss of 1 phosphate indicating that S168 serves as a target phosphorylation site for BTK. [E] CID spectrum reveals neutral loss of 2 phosphates indicating that S214 and S215 residues of IK serve as unique target phosphorylation sites for BTK.

