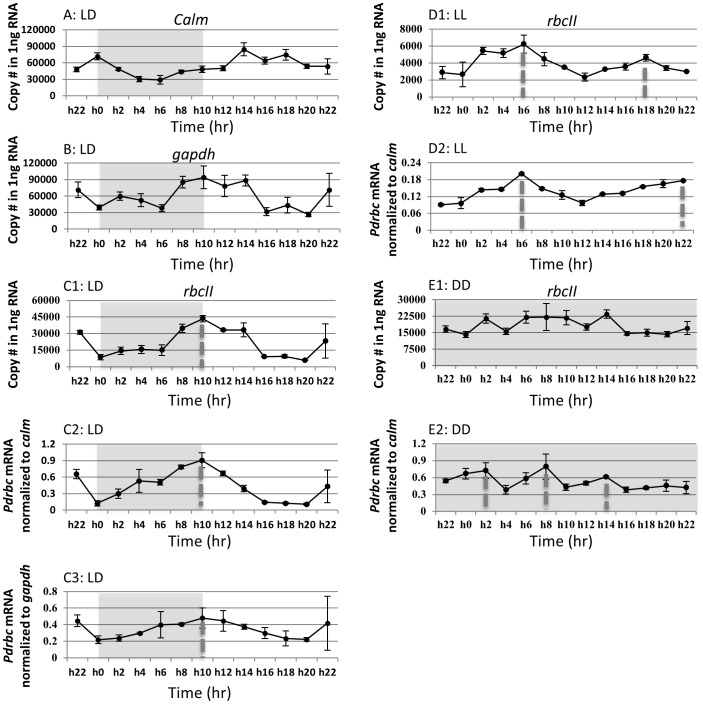
Figure 4. Gene transcription dynamics of reference genes (A–B) and Pdrbc normalized to total RNA (C1, D1, E1) and to the reference genes (C2, C3, D2, E2).
LD: under light/dark cycle. LL: under continuous light. DD: under continuous darkness. Sampling of the LL and DD cultures started after the cultures had been placed under LL and DD conditions for 22 h, respectively. Hatched bars denote dark cycle. Dotted lines in vertical denote the peak expression time point. Error bars indicate ± standard deviation.

