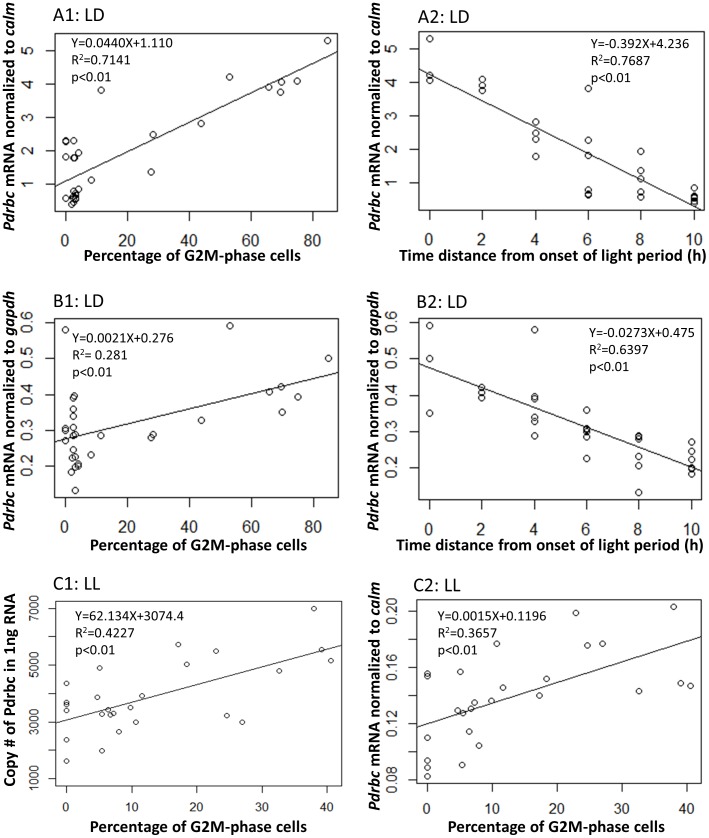
Figure 5. Correlation between Pdrbc mRNA abundance and percentage of G2M-phase cells as well as time distance from onset of the light period.
A1–A2: correlation between calm-normalized Pdrbc mRNA abundance and percentage of G2M-phase cells (A1) and time distance (A2) under light/dark cycle. B1–B2: correlation between gapdh-normalized Pdrbc mRNA abundance and percentage of G2M-phase cells (B1) and time distance (B2) under light/dark cycle. C1–C2: correlation between QTR- or calm-normalized Pdrbc mRNA abundance and percentage of G2M-phase cells under continuous light. Time distance, regardless before or after onset of the light period, is taken as positive values. As the culture was grown under a 14 h∶10 h light∶dark regime, time points over 10 hours backward from the onset of the light period would be in the light period again, we limited the correlation analysis to data within 10 hours from the onset of the light period. LD: under light/dark cycle. LL: under continuous light. DD: under continuous dark.

