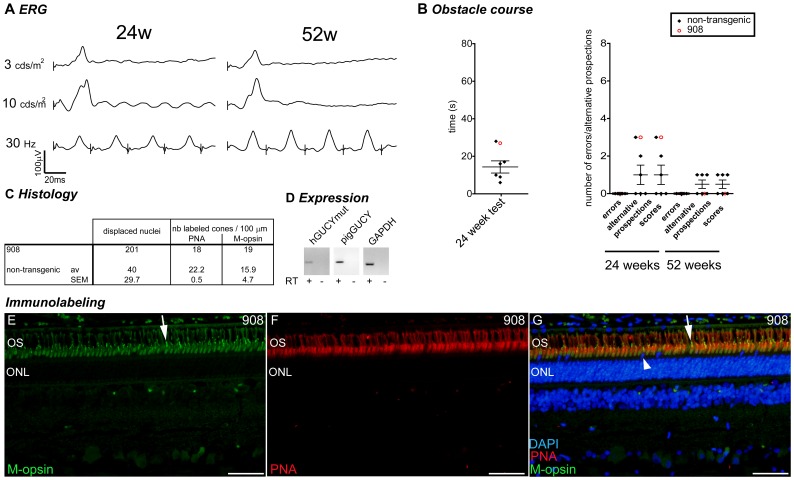
Figure 7. Case report: pig 908.
Grouped data for the transgenic pig 908 (2 integrated copies). (A) Photopic ERG (single flash 3 and 10 cds/m2 and 30 Hz flicker) at 11 and 52 weeks. (B) Behavioural observation for pig 908 (red opened circle) compared to non-transgenic control animals (black lozenges, mean and SEM depicted). For technical reasons, the time to reach the end of the obstacle course has not been measured at 52 weeks. (C) Histological quantification compared to the mean ± SEM of the non-transgenic controls. (D) RT-PCR analysis of transgene, endogenous GUCY2D and GAPDH gene expression in the retina. (E–G) Immunolabeling for M-opsin (E), PNA (F) and merged picture (G) in the central region of the retina of pig 908. Arrows in E and G show examples of M-opsin positive outersegment, arrowhead in G shows a displaced nucleus. W: weeks of age; OS: outer segment; ONL: outer nuclear layer (photoreceptor nuclei); INL: inner nuclear layer (interneuron nuclei); IS: inner segment; M-opsin: M-opsin antibody in green; PNA: peanut agglutinin in red; DAPI: dapi counterstaining in blue; GFAP: Glial fibrillary acidic protein in green; S-opsin: short wavelength opsin in green. Scale bar in E–G represents 50 µm.

