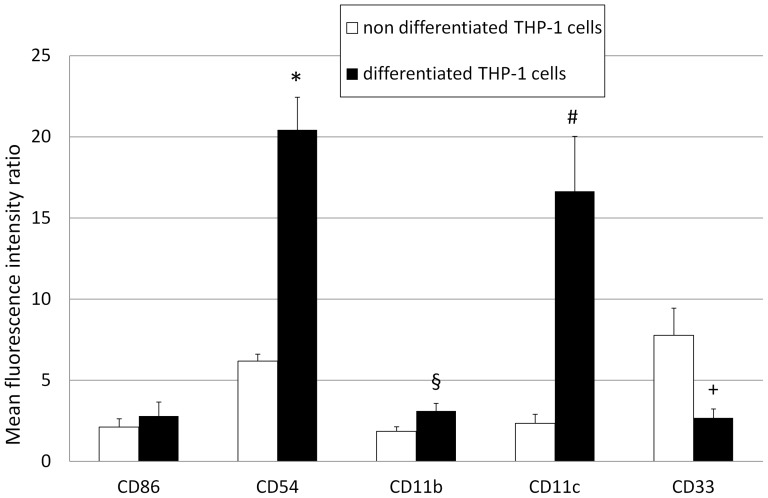
Figure 2. Quantification of fluorescence intensity by non-differentiated and differentiated THP-1 cells.
Membrane expression of CD54 (P = 0.033, *), CD11b (P = 0.031, §) and CD11c (P = 0.002, #) was significantly increased by differentiated ▪ THP-1 cells compared to non-differentiated □ THP-1 cells. A significant decrease of CD33 expression (P = 0.049, +) were observed and no significant difference of CD86. Errors bars represent standard deviation.

