
Figure 4. Fluorescence microscopy images of carboxylate microspheres in non-differentiated THP-1 cells and in macrophages.
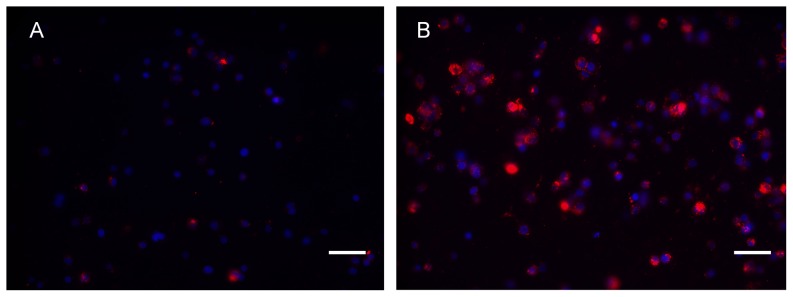
An increased carboxylate microspheres (red) concentration is observed in macrophages (B) than in non-differentiated THP-1 cells (A). Nuclei are stained in blue (DAPI). Magnification used was ×400. Bar : 20 µm.