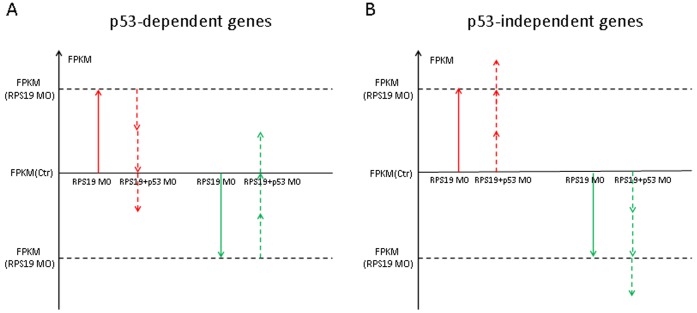
Figure 7. The scheme of detection of p53 dependent and independent genes.
The vertical axis represents the gene expression, which is normalized to FPKM. The red arrows indicate the variation trend of FPKM for abnormal up-regulated genes in RPS19 MO, and the green arrows indicate the down-regulated genes in RPS19 MO. Solid arrows indicate the variation trend of FPKM of genes in RPS19 MO, and dashed arrows indicate the variation trend of FPKM of genes in RPS19+p53 MO. Up−/down-regulated genes are screened with the criterion of a fold-change of >2.0 and a p-value of <0.05. (A) Up−/down-regulated genes in RPS19 MO compared with the control and down−/up-regulated genes in RPS19+p53 MO compared with RPS19 MO; we considered genes that satisfied the above criteria to be genes that are p53 dependent. (B) Up−/down-regulated genes in RPS19 MO compared with the control and up−/down-regulated genes in RPS19+p53 MO compared with the control; we considered genes that satisfied the above criteria to be genes that are independent of p53.

