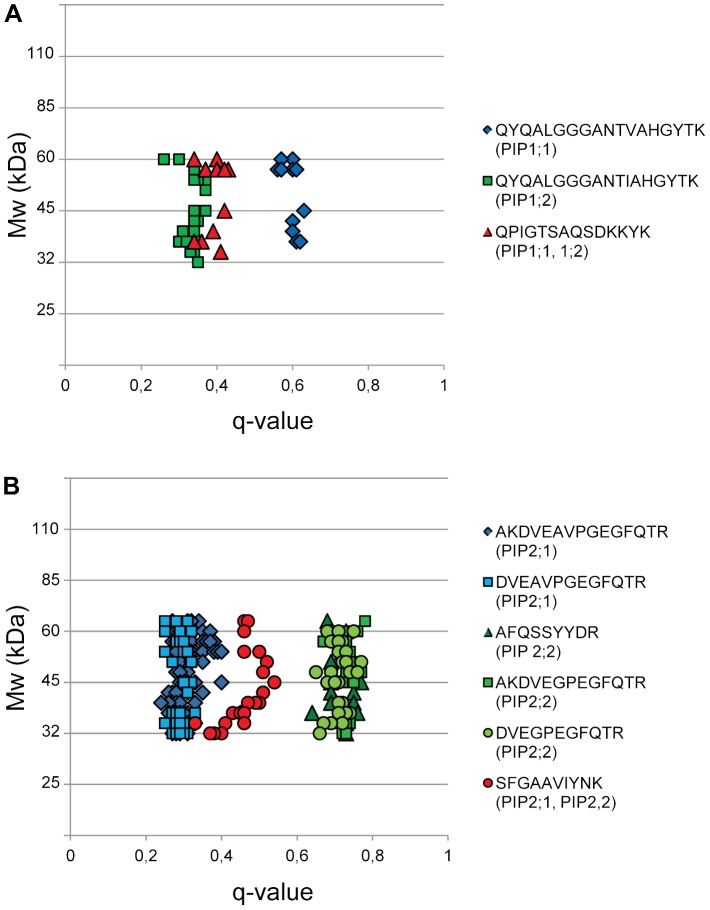
Figure 7. Q-values for peptides of PIP isoforms.
This is simplified version of the plot mentioned in the Data processing part. A, Q-values for two peptides unique to PIP1;1 and PIP1;2, respectively, and for a peptide shared between these two isoforms. B, Q-values for two peptides unique to PIP2;1 and for three peptides unique to PIP2;2, and for a peptide shared between these two isoforms. Note that PIPs with a monomer molecular mass of about 30 kDa band upon SDS-PAGE both as monomers and dimers, and also in the area in between 30 and 60 kDa. The molecular weights on the y axis are those indicated by the Mw standards used in the SDS-PAGE; the scale is therefore not lineal.

