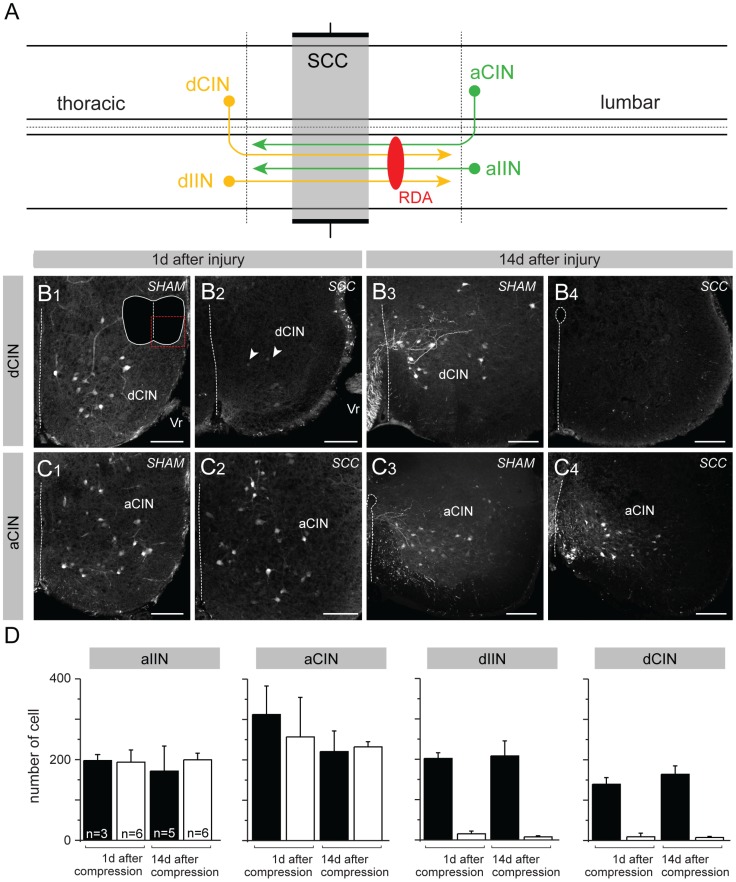
Figure 4. Loss of spinal neurons with descending axons traversing the injury following SCC.
(A) Schematic representation of interneurons, propriospinal neurons and projection neurons in the spinal cord based on [34]. The compression was performed in the lower thoracic cord (T10–12, grey area). RDA was applied one segment below the compressed region to label ascending (a) and descending (d) ipsilaterally (I) and contralaterally (C) projecting neurons (INs). (B and C) Representative confocal images of one side of the ventral region of transections containing RDA-labeled dCINs (B) and aCINs (C) in one sham and one SCC mouse 1 day (B1–2, C1–2) and 14 days (B3–4, C3–4) after surgery/injury. Very few are labeled in SCC (arrows, B2) compared to sham controls (B3). The inset in B1 shows the contour of the entire section with the imaged area indicated by the stippled red square. (D) Counts of labeled neuronal profiles of the indicated projection types within a 1 mm stretch of spinal cord immediately rostral to the compressed region (or the equivalent in sham animals) and immediately caudal to the RDA application site (see also Fig. S1). Bars represent averages of total counts taken from every other section in the relevant 1 mm length of spinal cord, with number of animals indicated in the first graph. Error bars represent standard deviations. Differences in counts of dIINs and dCINs between sham control and SCC animals are significant at p<0.025 at 1 day after surgery/injury and at p<0.01 at 14 days after surgery/injury (Mann-Whitney U-test, U = 0 in both cases). Scale bars: 100 µm. Additional abbreviations: Vr = ventral root.

