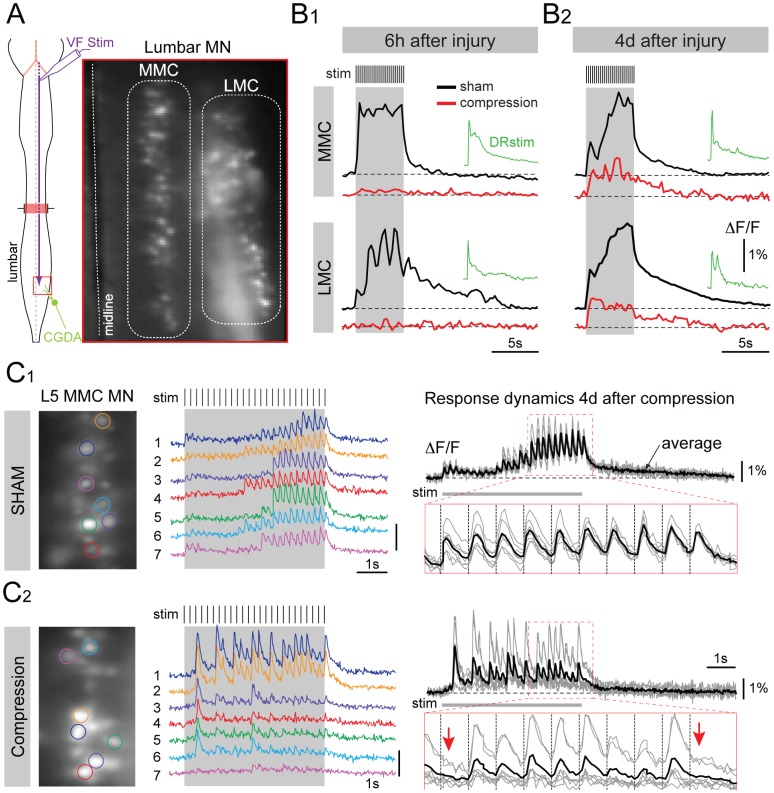
Figure 7. Recovery of responses to general bulbospinal pathway stimulation following SCC, assessed with optical recording.
(A) Schematic of the ex vivo preparation of the brain stem and spinal cord showing the site of bulbospinal pathway stimulation in the ventral funiculus (VF Stim) and the CGDA labeling of the L5 ventral root, and a photograph of the CGDA labeled lumbar MNs in the medial motor column (MMC) and lateral motor column (LMC). (B) Low temporal resolution (4 Hz frame rate) optical recordings of calcium transients elicited in MMC and LMC MNs in response to VF stimulation (same parameters as in Fig. 6) 6 h and 4 days after surgery/injury in sham control mice (B1 and B2, black traces) and SCC mice (B1 and B2, red traces). Green traces show responses to stimulation of the L5 dorsal root in SCC. ΔF/F represents fluorescence change in % relative to baseline. (C) High temporal resolution (50 Hz frame rate) recordings from individual L5 MMC MNs in response to VF stimulation in sham control (C1) and SCC (C2) mice 4 days after surgery/injury. Each colored trace shows the calcium transients in one of the individual MNs outlined by a colored region of interest in the photographic images to the left. Black and grey traces (right column) represent the superimposed individual traces (grey) and the averaged response (black) from the same MNs, with the expanded traces (outlined in red) showing the responses to the last 10 pulses of the train. Red arrows in the expanded trace of C2 (4 days post-injury) indicate absent calcium transients in response to the 15th and the last pulses of the train.

