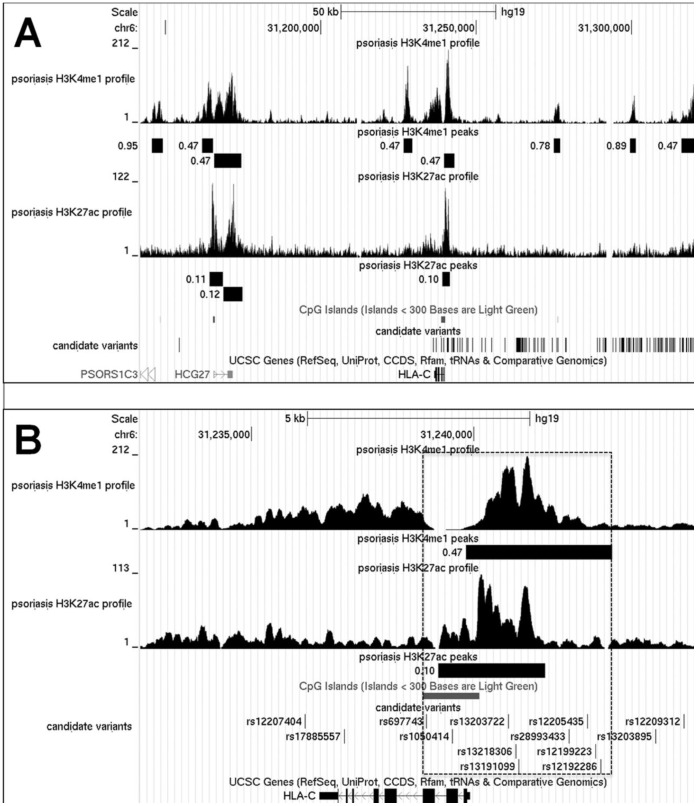
Figure 3. Epigenetic analysis of the refined PSORS1 locus in patient T-lymphocytes.
A) H3K4me1 and H3K27ac ChiP-Seq peaks are shown for a representative sample. The size of each peak is plotted as a black box immediately below the Chip-Seq track. The figure besides each box indicates the False Discovery Rate (FDR) associated with the identification of the peak (e.g. 0.47 indicates a FDR of 0.47%). B) A detailed view of the HLA-C gene region is shown. The dotted line box highlights the boundaries of the active regulatory region defined by the overlap of an unmethylated CpG island with H3K4me1 and H3K27ac peaks.

