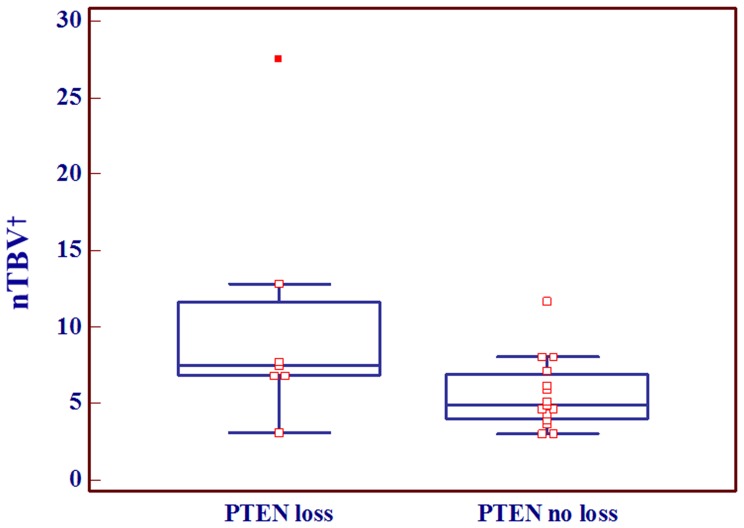
Figure 3. Box and whisker diagram displaying the relationship between normalized relative tumor blood volume (nTBV) and PTEN expression status in EGFR expression-positive group.
The EGFR expression-positive glioblastomas with PTEN loss showed statistically higher nTBV values than those without PTEN loss. Note– †nTBV: normalized relative tumor blood volume.

