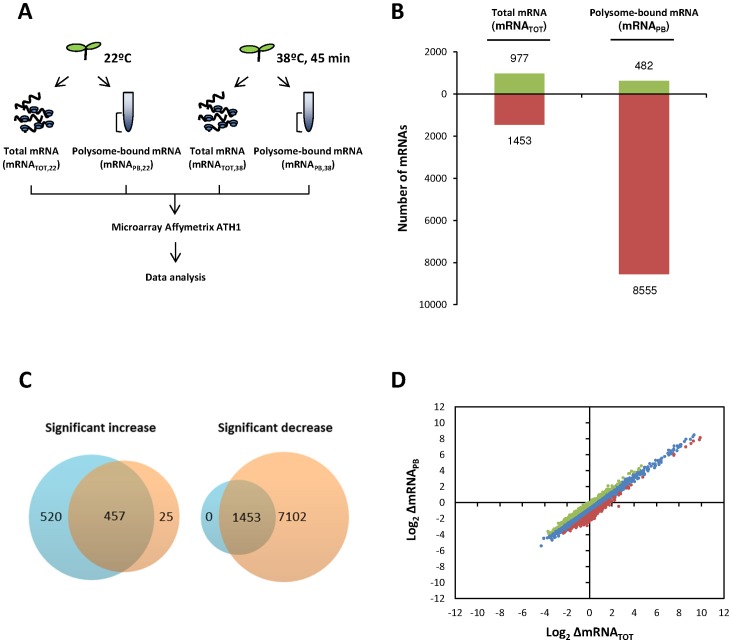
Figure 2. Comparison of heat-induced changes in steady-state and polysome bound mRNAs from Arabidopsis seedlings.
(A) Illustration of the experimental design. Total and polysome-bound mRNA from control or heat-stressed seedlings were isolated in parallel for microarray hybridization to Arabidopsis whole-genome Affymetrix ATH-1 platform and subsequently analyzed. (B) Graphic representation of the number of mRNAs with ≥2-fold variations in steady-state levels (mRNATOT) or in polysome association (mRNAPB) in response to the heat treatment. Green and red colors represent upregulated and downregulated mRNAs under heat stress, respectively. (C) Venn diagrams of heat-stress upregulated and downregulated mRNAs. mRNAs that only experienced significant variations in steady-state levels (≥2-fold variations in mRNATOT, FDR<0.05) are shown in blue, those that only experienced significant changes in their association to polysomes (≥2-fold variations mRNAPB, FDR<0.05) are shown in red. Merged section included those transcripts that significantly changed at both, transcriptional and translational, levels (≥2-fold variations in mRNATOT and mRNAPB, FDR<0.05) in response to the heat treatment. (D) Genome-wide comparison of the heat-induced changes in the transcriptome (x-axis, log2ΔmRNATOT) and the translatome (y-axis, log2ΔmRNAPB). The log2-values of the fold changes were plotted for all the probe sets included in the Affimetrix ATH-1 microarray (n = 22810). mRNAs with an average translation efficiency (log2ΔmRNAPB/ΔmRNATOT) are shown in blue, while mRNAs with ≥1.5 or ≤1.5 fold the average translation efficiency are shown in green and red, respectively.

