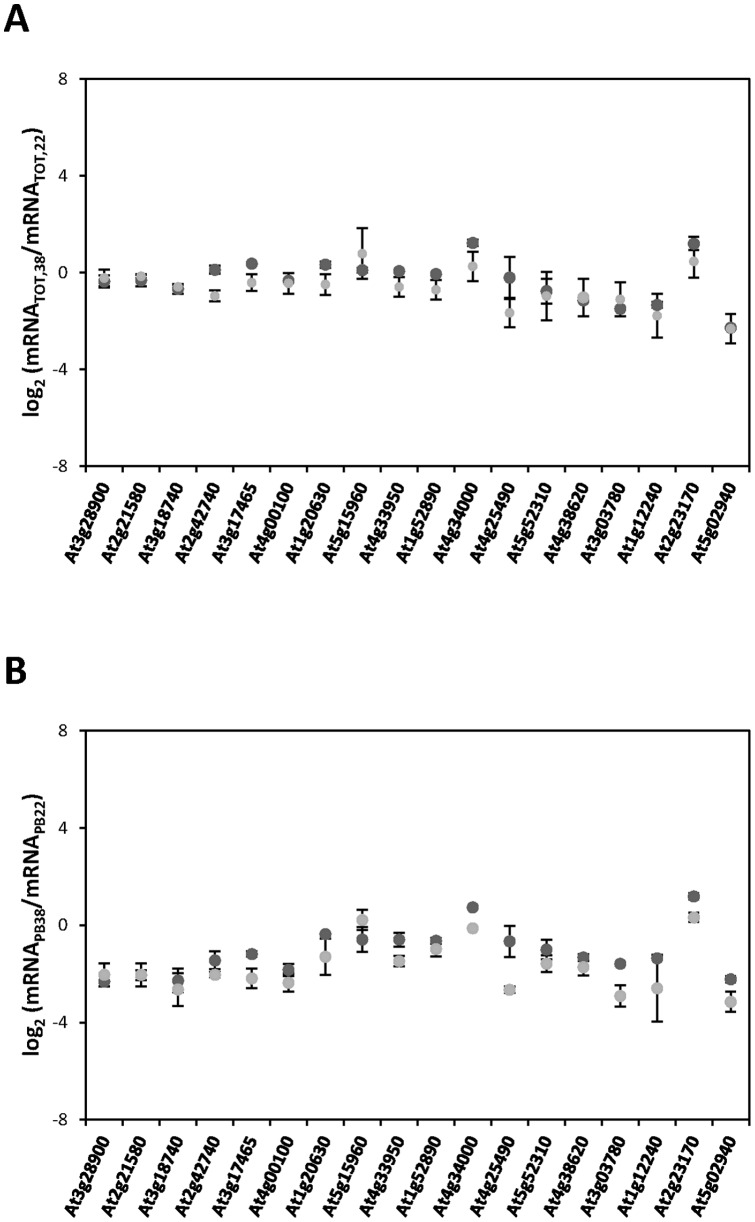
Figure 3. Confirmation of the heat-induced changes in transcriptome and translatome observed in the ATH-1 hybridization arrays by qRT–PCR.
For a representative group of mRNAs, the log2 changes in response to heat stress in steady-state levels (A) and in polysome-bound abundance (B) obtained from the ATH-1 hybridization arrays (dark-grey circles) were compared with the corresponding data obtained by the analysis of three independent biological replicates by qRT-PCR (light-grey circles). Mean (points) and standard deviations from the different replicates are shown.

