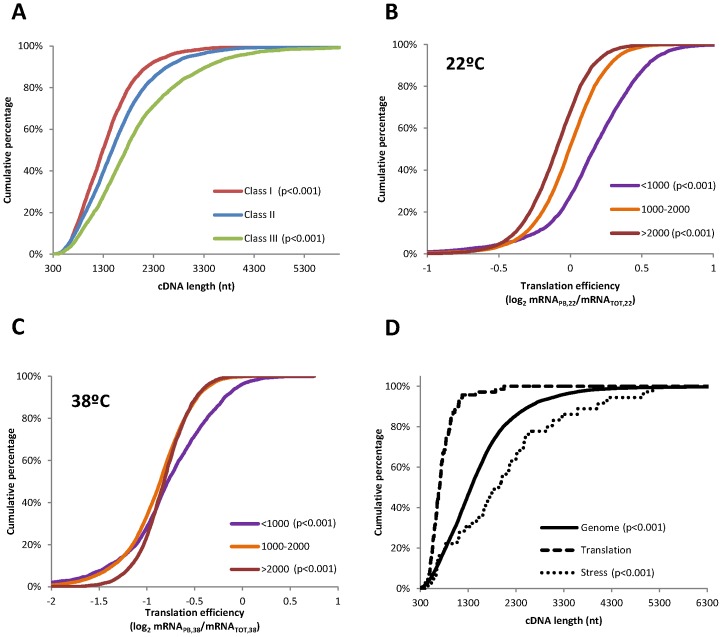
Figure 6. Heat selectively activates the translation of long mRNAs.
(A) Study of the distribution of cDNA length among the three different translational classes described in Figure 4A. (B–C) Analyses of the distribution of the mRNA translation efficiencies according to the cDNA length. mRNAs were divided in three different categories according to their cDNA length (<1000 nts in purple, 1000–2000 nts in orange, and >2000 nts in brown) and the cumulative curves for the translation efficiencies within each cDNA length group were analyzed at 22°C or at 38°C, respectively. (D) Cumulative curves showing the distribution of cDNA length in the whole Arabidopsis genome (solid line, n = 16098), within the genes in class I related with translation (dashed line, n = 70) or within the genes in class III related with stress (pointed line, n = 36). In all cases, statistical differences were determined by K–S test, using Class II in (A), 1000–2000 nts cDNA length group in (B) and the whole genome in (C) as reference. The corresponding p-values are indicated.

