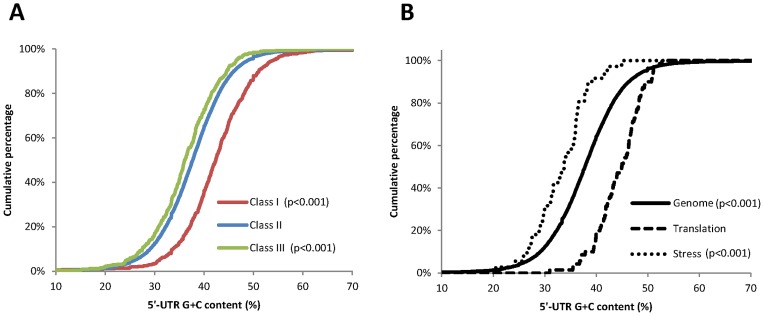
Figure 7. Heat selectively activates translation of transcripts with low 5′-UTR G+C content.
Distribution analysis of the percentage of G+C content in the 5′-UTR of the mRNAs belonging to (A) the three translational classes described in Figure 4A or (B) within the whole Arabidopsis genome (solid line, n = 16098), within the genes in class I related with translation (dashed line, n = 70) or within the genes in class III related with stress (pointed line, n = 36). Statistical differences were determined by K–S test using class II or the whole genome as a reference in (A) and (B), respectively. P-values, to determine statistically significant differences, are also shown.

