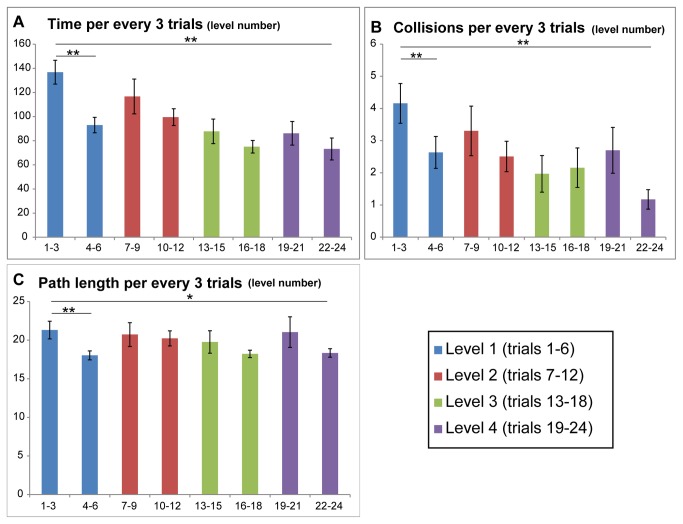
Figure 3. Average Time, Collisions & Path length.
All graphs show the results with trials grouped in 3 such that the first 3 trials of each level and the last three trials are grouped, creating 2 columns per level. Each level has its own color. In all graphs both a significant general improvement trend and a non-significant within-level improvement trend can be see (A) Average time per every 3 trials (B) Average number of collisions per every 3 trials (C) Average length of path per every 3 trials.

