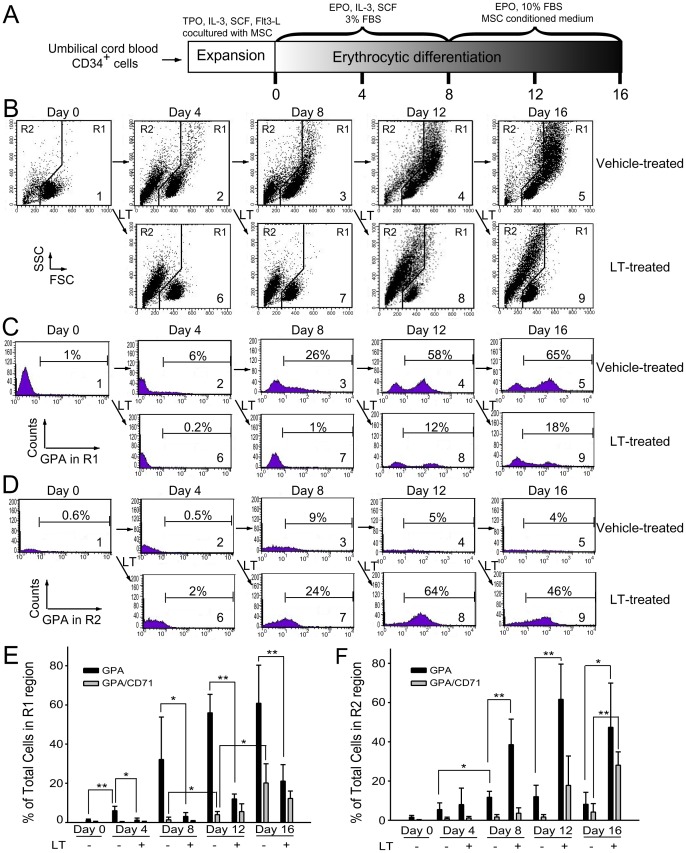
Figure 2. Suppressive effect of LT on in vitro erythrocytic differentiation.
The experiment outline of in vitro erythrocytic differentiation using human cord blood-derived CD34+ cells is shown (A). Flow cytometry analysis of the cell size (FSC) and cell granularity (SSC) are shown at various time points (B). The percentage of GPA+ (erythrocytic marker) cells in the R1 and R2 regions are shown in (C) and (D), respectively. The percentage of GPA and GPA/CD71 expression cells in the R1 and R2 regions at various differentiation times are shown in (E) and (F), respectively. Cells were treated with LT (20 ng/ml) during differentiation on Days 0, 4, 8, and 12. After the 4-day LT treatments, cells in each differentiation stage were harvested for additional flow cytometry analysis. Representative cell-populations and histograms (B–D) were shown. The total cell number was defined as 100%. *p<0.05, ** p<0.01, comparisons between groups are indicated. Data are reported as mean ± SD and represent results from 4 independent experiments.

