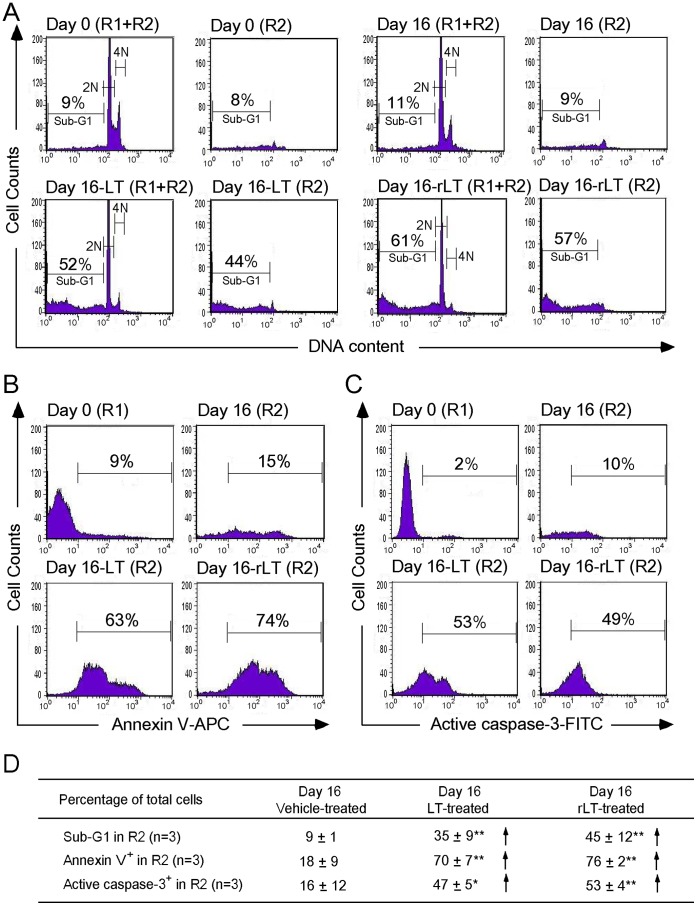
Figure 4. Characterizations of LT-induced hypoploid cells.
Human cord blood-derived CD34+ cells were treated using LT and rLT on Day 12 and analyzed on Day 16 during the in vitro differentiation of erythrocytes. The DNA contents were revealed by fluorescence intensities of propidium iodine (PI) staining. The hypoploid cells were increased in LT-treated and rLT-treated groups (A). Annexin V-APC (B) and active caspase-3-FITC antibodies (C) were used to characterize the apoptotic cells in R2 region by flow cytometry. The percentage of sub-G1 cells on day 0 and annexin V+ and active caspase-3+ cells of R1 region on day 0 were used as basal level controls. Representative histograms (A–C) and summarized events (D) were shown. *p<0.05, ** p<0.01, compared to vehicle-treated controls. Data are reported as mean ± SD and represent results from 3 independent experiments.

