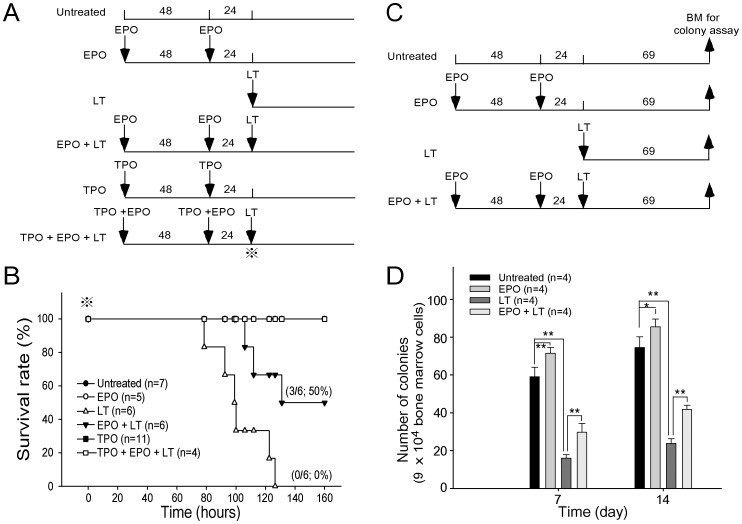
Figure 5. EPO treatments reduced LT-mediated mortality and erythropoiesis suppression in mice.
The experimental outline of the survival rate analysis is shown in (A). The survival rate of mice treated with EPO, LT, TPO, EPO in addition LT or TPO, and EPO plus LT is shown in (B). Untreated mice were used as negative controls. The symbol ⋇ marks in (A) and (B) indicate the starting point for recording mortality. The experimental outline of the in vivo erythroid colony-forming cell assay is shown in (C). Colony numbers of BM cells from mice treated with EPO, LT, or EPO in addition to LT by the erythroid colony-forming cells assay on Days 7 and 14 is shown in (D). BM cells from untreated mice were used as controls. *p<0.05, ** p<0.01, comparison between groups are indicated. Data are reported as mean ± SD, and represent results from 4 independent experiments.

