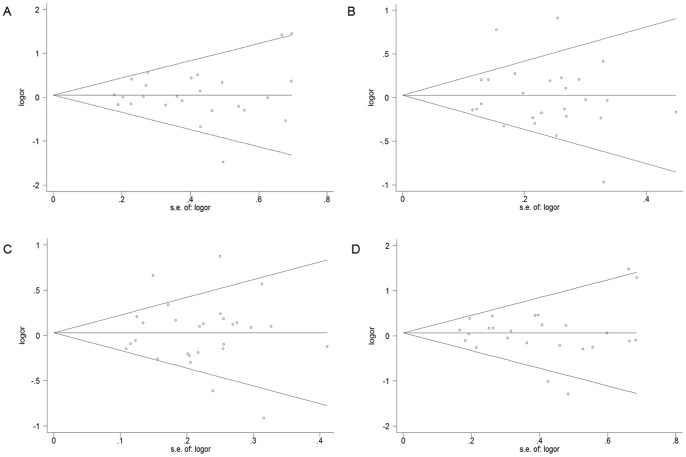
Figure 3. Begg’s funnel plots for publication bias test on studies assessing GSTP1 Ile105Val polymorphism and prostate cancer risk (A, Val/Val vs. Ile/Ile; B, Val/Ile vs. Ile/Ile; C, Val/Val vs. Val/Ile+Ile/Ile; D, Val/Val+Val/Ile vs. Ile/Ile).
Each circle represents as an independent study for the indicated association.

