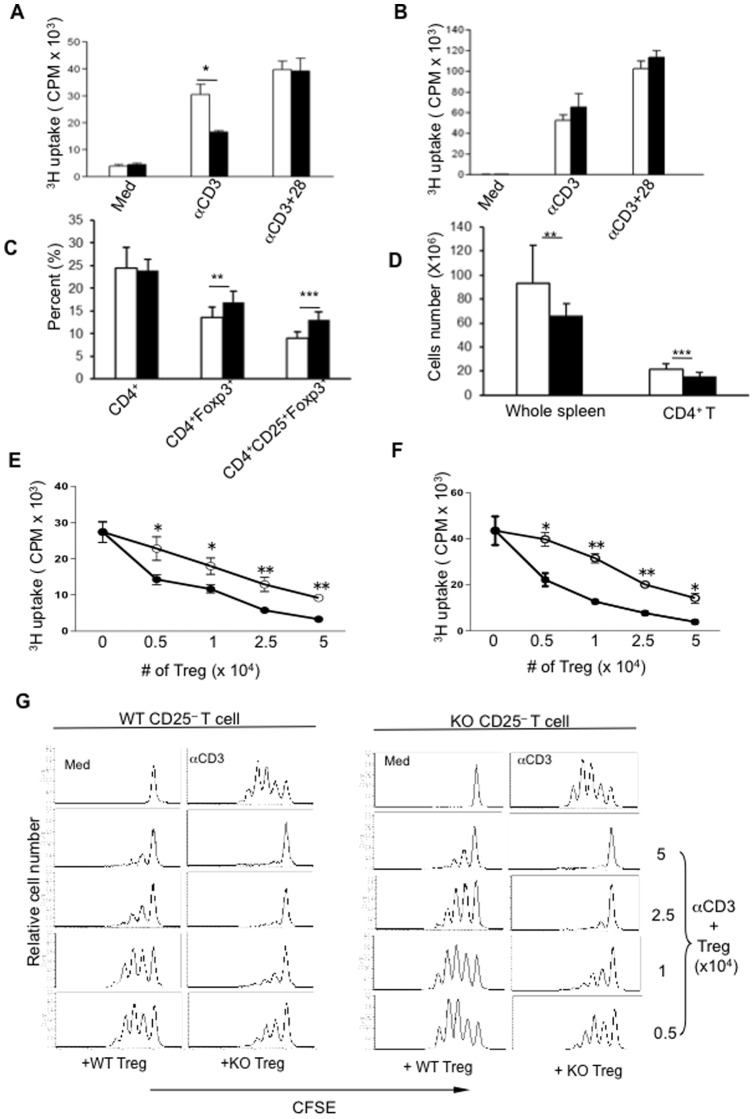
Figure 1. Deletion of PARP-1 confers stronger immunosuppressive function in Tregs.
Whole spleen cells (A) or purified CD4+CD25− T cells (B) from PARP-1−/− and WT control mice were stimulated with soluble anti-CD3 antibody (A) or plate-coated anti-CD3 antibody (B) or plus soluble anti-CD28 antibody. Cell proliferation was measured by 3H-TdR uptake after 3 days culture. (C) The frequencies of CD4+, CD4+Foxp3+ and CD4+CD25+Foxp3+ T cells in spleen of PARP-1−/− and WT control mice (WT, white bar, n = 15 mice; PARP-1−/−, black bar, n = 13 mice) were analyzed by flow cytometry. (D) The cells number of whole spleen cells and splenic CD4+ T cells PARP-1−/− and WT control mice (WT, white bar, n = 15 mice; PARP-1−/−, black bar, n = 13 mice). (E−F) CD4+CD25+ Tregs from PARP-1−/− and control WT mice (WT, white circle; PARP-1−/−, black circle) were cultured with freshly isolated WT CD4+CD25− (E, 5×10⁴) or PARP-1−/− CD4+CD25− (F, 5×10⁴) T cells in the presence of WT splenic APCs at indicated cell numbers. T cells proliferation was determined by 3H-TdR uptake after 3 days. (G) CFSE-pre-labeled WT (left two column graphs) or PARP-1−/− (right two column graphs) CD4+CD25− T cells (5×10⁴) were cultured with indicated numbers of CD4+CD25+ Tregs in the presence of WT splenic APCs for 3 days. The cells were then stained with anti-CD4 antibody, and CD4+CFSE+ cells were gated and displayed as histograms by flow cytometry. The data are shown as Mean±SD Experiments were performed 3–5 times, *p<0.05, **p<0.01, ***p<0.005.

