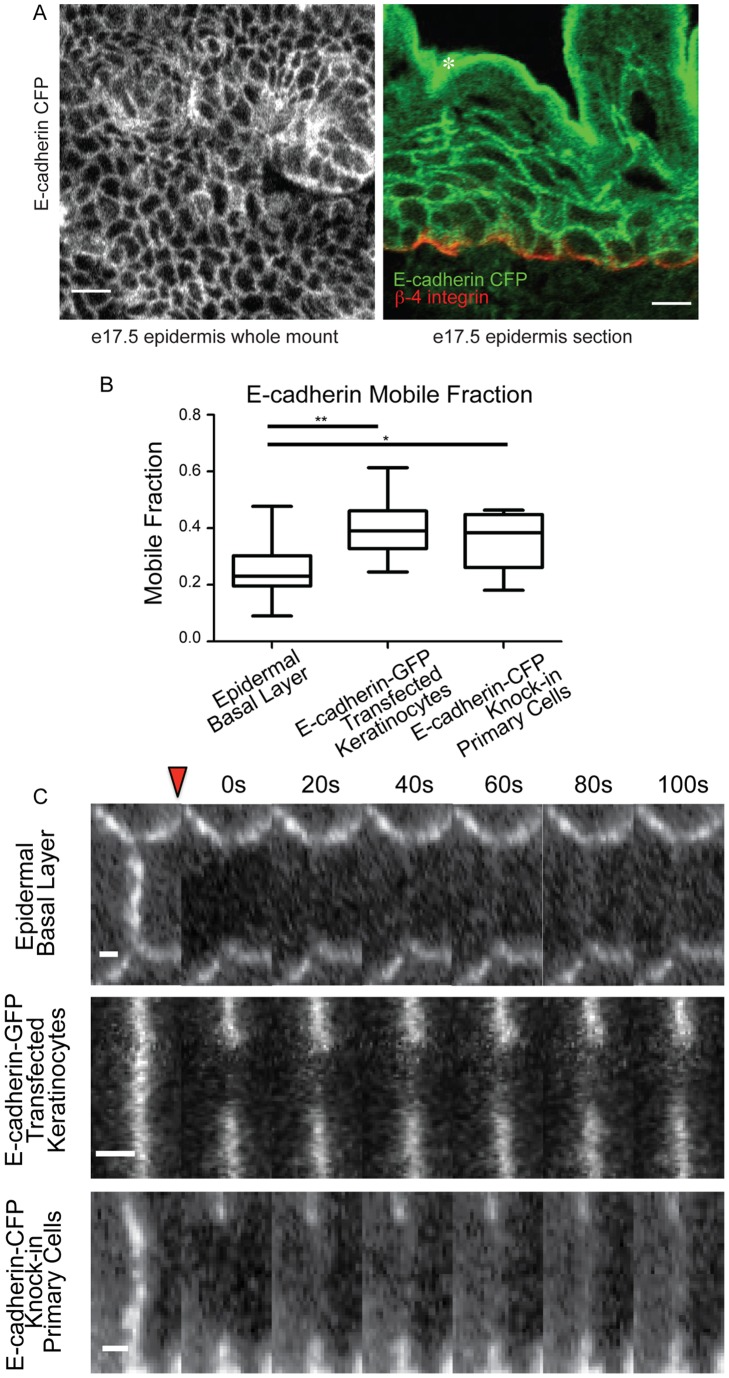
Figure 2. E-cadherin shows limited recovery at adherens junctions in tissue.
A) Wholemount (left) and cross section view (right) of E-cadherin-CFP epidermis. In the cross section, β4-integrin staining was used to define the basement membrane (red). Scale bars are 10 µm. B) Mobile fractions from FRAP experiments are plotted. The box represents the 25th to 75th percentile and the whiskers represent the 10th and 90th percentiles. * p<.02. ** p<.001. C) Representative kymographs are shown of individual FRAP experiments. The bleach point is indicated by the red triangle. Scale bar 1 µm.

