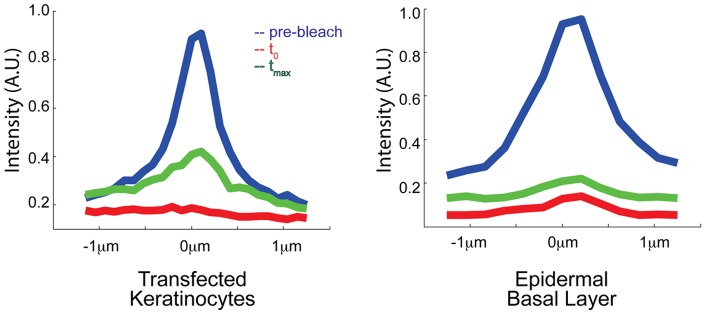
Figure 3. Intensity profiles of fluorescence recovery.

Graphs show the average intensity profile across bleached junctions in E-cadherin-GFP transfected keratinocytes and in the basal layer of the epidermis from E-cadherin-CFP e17.5 embryos. Time points plotted are directly before bleaching (pre-bleach), directly after bleaching (t0), and at maximum intensity recovery within five minutes (tmax). Each graph shows the average data from n>8 junctions for each condition. Intensity is displayed in arbitrary units for each condition.
