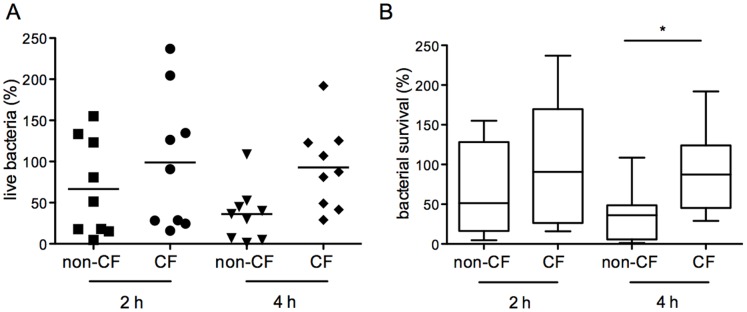
Figure 2. P. aeruginosa survival in human lung non-CF and CF macrophages.

A) Live intracellular bacteria rescued 2 h and 4 h after infection. Data were normalized to bacteria recovered at the end of the infection (t0) set as 100%. Each symbol represents a single subject/patient. The line shows the median percentage live bacteria. B) Box plots of data in A. The 25 and 75 percentiles, median, minimal and maximal are shown. Statistical analysis (Mann Whitney non parametric test), non-CF vs CF 2 h and 4 h after infection: p = 0.297 and *p = 0.0188, respectively.
