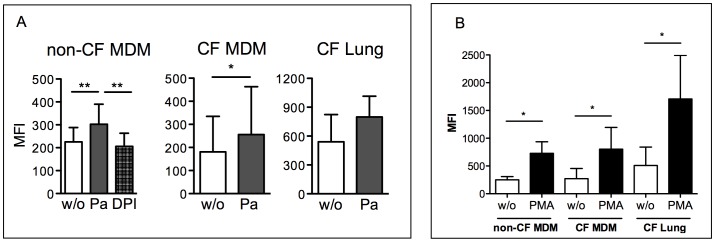
Figure 5. Intracellular ROS production by human control and CF macrophages challenged with P. aeruginosa.

A) Macrophages loaded with CM-H2DCFDA (DCF) were infected with P. aeruginosa. Mean Fluorescence Intensity (MFI) of non infected (w/o) or infected (Pa) macrophages was measured by flow cytometry. B) Relative ROS production induced by phorbol 12-myristate 13-acetate (PMA), as detected by the change in fluorescence calculated with the following formula: ΔDCF fluorescence = MFI infected – MFI uninfected . Samples: monocyte-derived-macrophages (MDM), from non-CF subjects (n = 8) and CF patients (n = 6); lung macrophages from CF patients (CF Lung, n = 3). Statistical significance (Wilcoxon non parametric student’s t-test) *p<0.05, **p<0.01.
