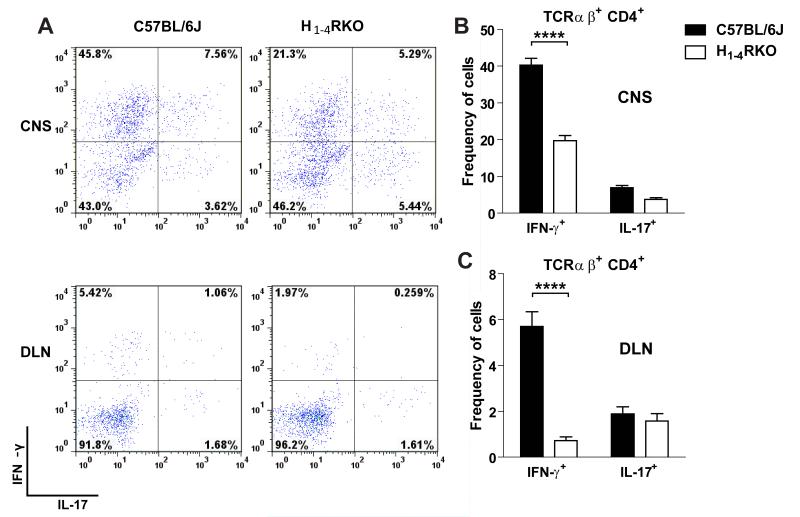
Figure 4. Reduced frequency of IFN-γ+ CD4 T cells in the CNS and DLN of immunized H1-4RKO mice.
Mononuclear cells were isolated from the CNS and DLN of 1× immunized mice on d15 post-immunization, stimulated with PMA/ionomycin for 4 hours in the presence of Brefeldin A, stained, and analyzed by flow cytometry. (A) Representative flow cytometric data of the frequency of IFN-γ+ and IL-17+ cells from CNS and DLN, gated on TCRβ+CD4+. (B and C) Percentage of IFN-γ+ and IL-17+ cells from CNS and DLN, gated on TCRβ+CD4+of WT and H1-4RKO mice. Data are shown as mean ± SEM of n = 8 per strain. Significance of differences observed in the percentage of cytokine positive cells were determined by two way ANOVA followed by Bonferroni’s post hoc multiple comparison test (****, p<0.0001).

